Cite as: Stefanescu, D., 2020. Alternate Means of Digital Design Communication (PhD Thesis). UCL, London.
5.1 Challenging Centralisation
The previous chapter introduced a new methodology for data encoding and decoding that was aimed at better suiting the AEC industry’s communication needs. Going forward, this chapter will investigate what is the best way to persist (or store) the information that is being transacted within the design process by comparing existing methods, which are largely model- or file-based, to an alternative approach that is built on top of the solution proposed in Chapter 4, Data Representation.
Traditionally, digital design data is stored within models. It is mostly produced in specialised modelling or drafting software and thereafter saved in files on a local hard drive. The concept of a file dates back to the 1950s, and its definition has remained, since then, rather stable: it is an ordered array of binary information that can be, in one way or the other, decoded. These decoding algorithms are, depending on the file itself, open source or proprietary. In the case of AEC software, most of it is reliant on the latter kind of software; as such, one needs to have access to the specialised modelling software that produced it in the first place, or one that has a similar decoding capability as well. Subsequently, design files can be seen of having a certain atomicity and impregnability; they resist outside scrutiny; this has tended to isolate the information produced by the AEC industries from the outside world.
The de facto collaborative approach in AEC is centred around the idea of a federated, central model, or one single source of truth, that contains, synchronises and validates the information produced by all technical stakeholders involved in the design process. This can be traced back to Eastman’s work on GLIDE (Eastman et al., 1975) and BDS (Eastman, 1980). Essentially, it mandates that all the discipline specific models that are being produced within the design process are centralised within one “master” model, which represents the single source of truth. It evolved as an answer to the perceived “babelian” situation of the AEC industry (Hamil, 1994), in which all the stakeholders would talk to each other, apparently at random and without the possibility to coordinate altogether—see the left side of the diagram below (Figure 23). The proposed solution was twofold: first, a centralised common standard for data representation, namely IFC, which was discussed at length in the previous chapter; second, a centralised model that would hold all the information in one specific place and be the vehicle through which all communicative exchanges involving design data would take place; that is, the carrier for the data’s representation.
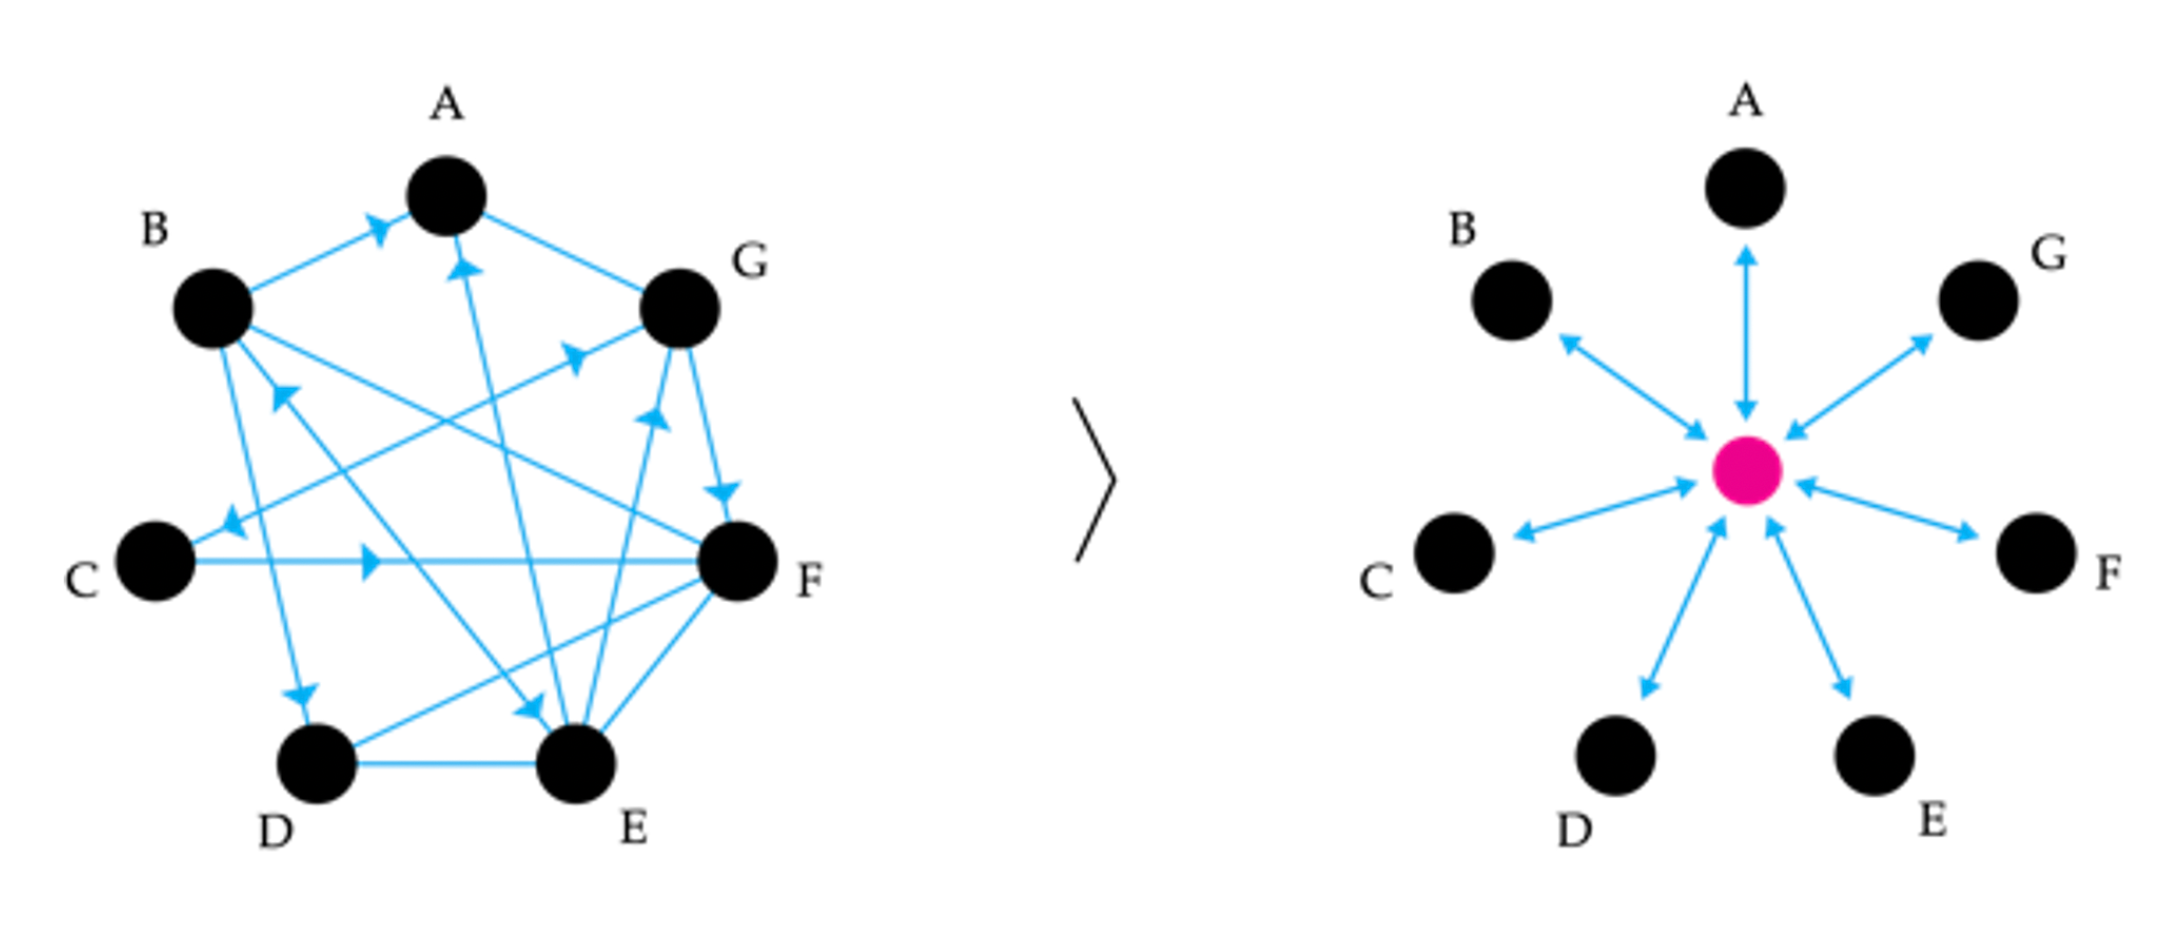
Figure 23: Left, the tangled communication patterns of the design process; right, the centralised “one model” approach currently in use in AEC.
The “one model” approach is reflected in the mandatory inter-relation of building objects prescribed by the data representation standard in use or by the architecture of the software used. For example, as mentioned in the previous chapter, Data Representation, the latest IFC release states that “round-tripping” of single objects is out of scope and, in general, not supported (Bentley Systems, 2008; buildingSmart, 2016; Thein, 2015). This is because to “round-trip” an object one needs to extract it from its context, and be able to decode it meaningfully without access to the file it originated from. Moreover, the previous chapter has also shown how encoding an object defined by a canonical implementation of the IFC standard actually implies serialising all the other information present in the IFC file itself, including any other objects, because of the tight coupling of the class definitions.
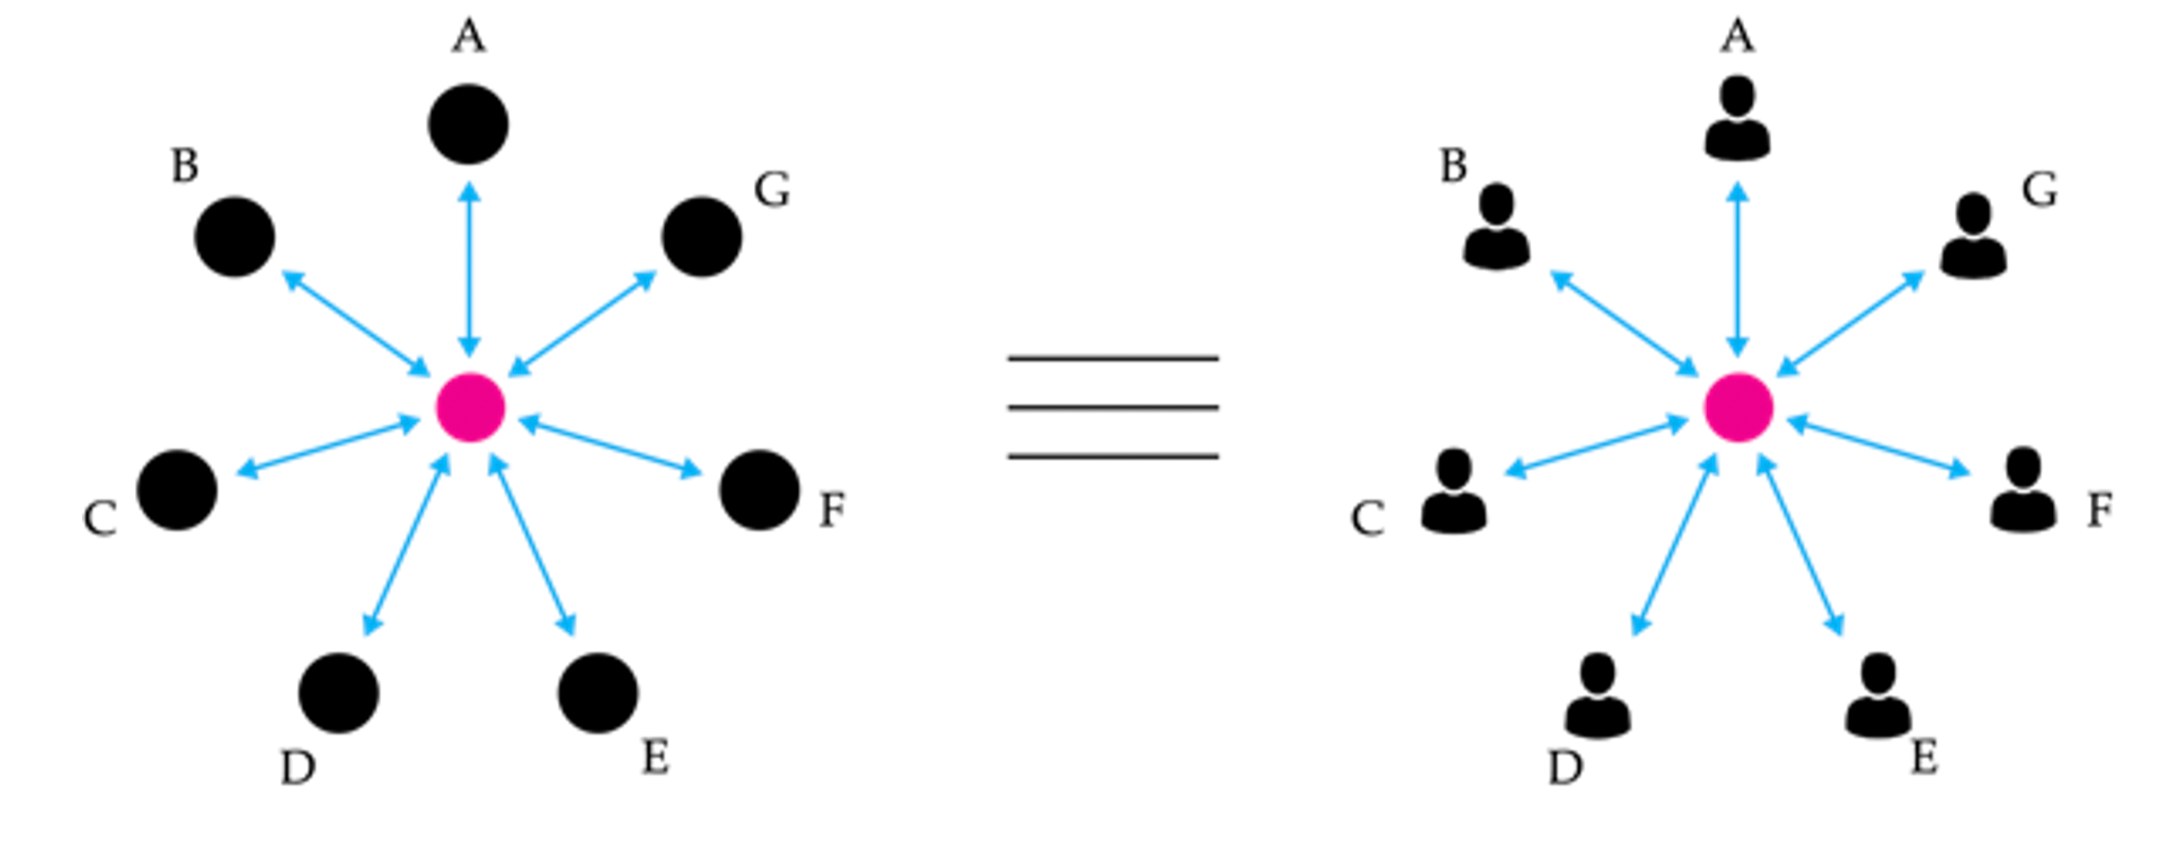
Figure 24: The contemporary equivalence between a technical model of communication and a social one.
The in Figure 24 is also used to describe the mandated workflow practice for exchanging information—communicating—in a design process, between all the actors involved. Informal communication practices, for example ones bypassing the central model, are discouraged: there is an assumed equivalence between the technical model and the social one. Nevertheless, Chapter 2, Literature Review has shown that appropriating technical models of communication and mapping them on other, non-technical domains, may be detrimental to the process they are attempting to describe or enable. Consequently, the following chapter can be seen as challenging the current projection of a technical model of information exchange onto an essentially psycho-social phenomenon of communication.
Further supporting this challenge is the fact that practice, as well as literature, show a proliferation of customised workflows. These are being developed internally by various AEC companies to serve various project specific (or company specific) interoperability, communication and data processing needs. Summarily put, these efforts amount to extracting, filtering and curating data out of the monolithic files that digital design information usually resides in, and re-assembling it for different purposes, usually dependent or defined by various actors that are involved in the design process. These customised workflows can be seen as informal[23] communication channels—usually, they are not legally specified or part of official documents—that evolved from the communicative interaction between various groups of actors. As such, freed from the weight of an official imposed methodology, they usually are lean and efficient: the parties involved have had the space to minimise cognitive as well as machine processing effort, as well as optimise the quantity of information being transacted. Consequently, the following chapter will assess the viability of an informational system for the design process that can support the emergence and evolution of a natural communication network between the actors involved in the design process.
5.2 From Sharing Files to Curating Data
In order to understand what is the best way to structure design data information for communicative purposes, one has to first look at how it is produced, or created, within the specialist software it originates from, as well as how one can expect end-users to structure it. The following section shall assess the process of classifying information in existing CAD software and, most importantly, how different interactional mechanisms of sharing influence the nature and quality of the communicative process.
Traditional modelling applications produce design data through direct user input: an architect, engineer or other specialist actor draws building elements. Afterwards, users select objects with their mouse in order to interact with them, and when they do so they either choose one object or more; in the realm of parametric modelling, the output of a given function—either a singular object or an ordered series thereof —is then selected by the user as the input of another operation. Nevertheless, a file-based sharing approach essentially eliminates the cognitive step of “selection”, or filtering, at an object level; the whole model is “communicated”. Consequently, when centralising all information in one model as current formal practices mandate, the information thus exchanged is dissociated from its meaning and reason to exist, as there was no prior step of selecting what is needed or for what purpose. The designer “shared the model”—but why, and for what reason? Unfortunately, this results in informational waste that adds friction to the communication process: it places a big burden on the receiver to filter and extract what he or she needs from the information available to them, not to mention the technical implications that arise from transacting, storing and managing the large quantities of design data that are produced.
Thus, a communication process that is based on purely passive production of information without heeding its relevance or purpose can be seen as dysfunctional. It violates Grice’s third maxim of the “Cooperative Principle”, namely the one that simply states “be relevant”, as well as the first maxim, that of quantity (“make your contribution as informative as it is required; do not make your contribution more informative than it is required”) (Grice, 1991). Furthermore, this sharing model does not encourage end-users to maximise the communicative relevance of information, as described by Sperber and Wilson (2012), because it increases processing effort required on the behalf of the receiver, and lowers the potential for positive cognitive effects to emerge.
To exemplify, the diagram below is one of the results from a workshop on practice workflows undertaken together with this project’s industry partners (Figure 25). Data from this workshop serves as the basis of two aspects of the analysis: first, it represents an inquiry into how data is structured in AEC data flows; second, it serves as a basis for the evaluation of existing transactional friction thereof, which will be discussed at length in the following chapter. Looking through the former lens, it highlights a recurring pattern of information distribution in one of the most common workflows in the design process, namely that between an architectural stakeholder and an engineer. It reveals the fact that, in order to perform the required analyses for a building project, an engineer typically curates the architectural model, with its geometry and associated metadata, in several different ways. These curated sets of data allow her or him to perform specialised tasks using digital tools specifically geared towards solving subsets of engineering problems, such as seismic analysis, wind analysis, footfall and crowd simulations, energy studies, etc.
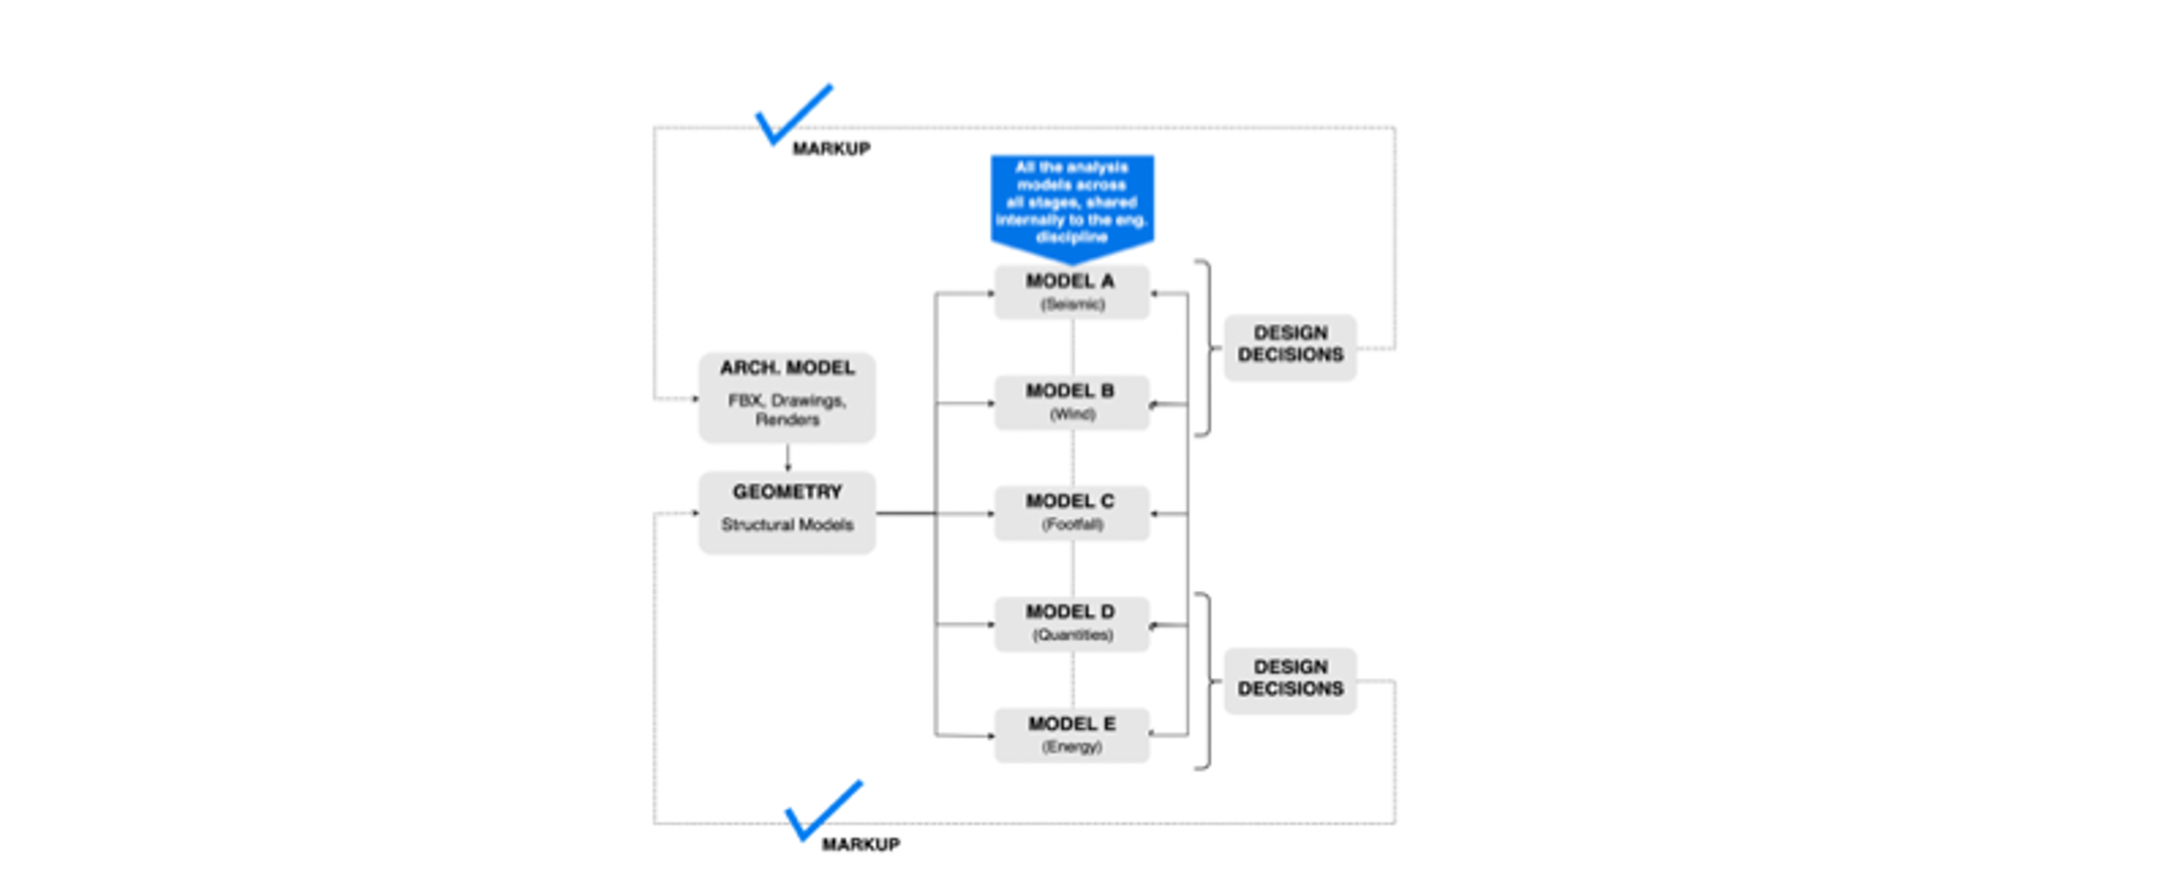
Figure 25: Diagram showing the typical ways design information is cast into separate models for specific analysis tasks, and the subsequent feedback of the results in the design model.
For example, a wind analysis requires, in most cases, just the outer shell of the building – its façade. An energy analysis model is based on volumetric room information coupled with the openings (windows, doors, etc.) and their nature (glazing coefficients, thermal inertia, and other material properties). One of the most computationally intensive analysis, the seismic assessment of a structure, usually takes as an input a three dimensional volumetric model of the structure, which thereafter it transforms into a four dimensional model (including the “inside” of objects). All of these models, at their base, share a common model coming from the architect, nevertheless they each require specific subsets of data from it, and apply custom transformations on it. Currently, the act of curating the right data for the right task is happening through a tedious process of generating secondary models from a “master model”, typically provided by the architect. These are thereafter exported as separated files and subsequently imported in the specialised analysis software. The participants revealed that, in some cases, they can spend up to half of their day cleaning, curating, exporting and managing this specific aspect of the process.
This situation arises because the effort of “decoding” information, in a file-based collaboration environment, is left entirely to the receiving party; the sender just “shares the file”. Subsequently, the proposed alternative approach seeks to balance the effort of curating information. Subsequently, it requires a cognitive action from the communicant of pre-filtering, or selecting, the objects that will be subsequently encoded, persisted in the database, and thus available to others. By doing so, actors involved in the design process are encouraged to “think before they speak” – the extent to which this approach was successful is analysed later on in this chapter, in Section 5.7.1. In other words, this amounts to assessing and shaping the relevancy of their communicative act: instead of simply sharing all the design data they produce (and thus place a high processing barrier on the receiver as well as risk communicating the wrong data), they must engage in a cognitive process of evaluating what information to share and for whom it would be relevant.
When design information is produced, usually the software employed has its own specific ways to classify information in order to help the user in achieving their task. Excel, for example, is based on a tabular paradigm of rows and columns; nevertheless, CAD applications usually have multiple ways of organising design objects. These can be either based on a hierarchical scene graph, in the case of CATIA, or simpler systems such as layers, which are present in Rhino and AutoCAD. Other applications, for example Vectorworks, provide more ways to classify data: objects are categorised based on “classes”, “layers” and “levels”. Furthermore, most software allows for objects to be grouped together in either “Groups”, which are just a superficial way to keep them together, or “Blocks” which are archetypal representations of one or more objects that can have multiple instances existing with different transform properties. Most probably, there are many other conventions for how design data is structured depending on the software used. Furthermore, visual programming introduces a separate, programmatic (code-based), approach to creating design data in which the produced information is ordered and grouped by the functional operation that created it.
At a programmatic level, the most productive common denominator amongst all of the models above, when it comes to information sharing, is a list of objects. In other words, a list is a group of objects that an end-user would want to transmit to another. This group may be ordered, if produced in a programmatic environment, such as a parametric modeller, or unordered if the result of an arbitrary selection. Moreover, a design model is essentially a group of objects; all the ways of classifying these objects (layers, classes, levels, etc.) are essentially customised ways of filtering and structuring this object collection based on an element’s properties (which can be either inferred or directly assigned to by the designer). Furthermore, design information is in continuous flux as it is produced and revised throughout the process. As such, an initially shared selection will change through adding, editing and/or removing objects.
Consequently, in order to facilitate the end-user to curate and share dynamic groups of objects, a new object is needed, namely a SpeckleStream. Essentially, it represents a group of other SpeckleObjects that have been selected by a communicant in order to be shared. It can be as large as a whole model, or as small as to contain only one object. Its naming implies its dynamic nature: SpeckleStreams can be constantly changing, nevertheless they exist independently of the objects they collate and thus provide a fixed point of reference that can be later on referred to. The following section expounds on the technical implementation needed to materialise this concept.
5.3 Enabling an Object Oriented Data Platform
The previous chapter has described the specification of an extensible low-level object model for digital design data, as well as its implementation in C#, based on the .NET framework. This implementation allowed for the serialisation and deserialisation of objects—that is, encoding and decoding them and is part of what usually is called the application layer. As follows, it needs to be extended to incorporate a persistence layer—or memory—where these objects will be stored, retrieved from, and classified.
5.3.1 System Architecture
The approach used is following a three-layer architecture pattern, which is a classical and wide-spread multi-tier software design approach (Gamma et al., 2015). Essentially, this means that an information system is segregated into distinct parts that deal with one or more specific application concerns independently of each other. These application compartments interact through clearly defined rules, usually encapsulated in the form of APIs. The three main layers are usually referred to as the (1) presentation layer, the (2) application layer and the (3) persistence (or storage) layer. (1) is usually the topmost level of the application, and is a layer users[24] can interact with directly (for example, the GUI); (2) encapsulates all the logic that the application requires, and is usually separated as well into multiple sub-layers; finally, (3) contains the persistence mechanisms, such as databases or file shares, where an information system can persist its state (Gamma et al., 2015).
The most direct approach is to write the serialised object data directly to disk as a binary blob and subsequently rely on a file share to make this data more widely accessible; nevertheless, this technique would suffer from the same resistance to scrutiny that was pointed out in the beginning of this chapter, as it is reliant on files. Consequently, the technical instrumentation, Speckle, shall employ an open source document-oriented database, MongoDB, as its storage layer. The motivation as to this specific choice—there are other similar solutions, such as RethinkDB, CouchDB, etc.—lies in the fact that it is a well-documented and flexible database that allows for the coexistence of structured as well as unstructured data—fact which matches with the open-ended schema definitions presented in the previous chapter. The option for a NoSQL[25] instead of an SQL solution (for example, MySQL or MariaSQL) was driven by the fact that Speckle will need to be able to query the memory layer also based on non-indexed fields—basically on the ad-hoc defined properties of composed objects.
As usual, a given storage layer exposes an API through which data can be written into the system and as well read out. Therefore, a potential approach would be to extend the .NET-based SpeckleCore library with client read-write capabilities directly to the MongoDB database. Nevertheless, a middle application layer is introduced. Its role is to mediate the transactions between the database and the clients that consume and produce the data and offers room to enable various system-wide cross-cutting concerns, such as user authentication, permissions, data validation, rate limiting, security and encryption, and a more universal way of exposing data to outside actors and third-party applications. This middle application layer is based on a REST API and is implemented through a NodeJs based server (SpeckleServer). The SpeckleCore library is extended with an ApiClient class that exposes methods for calling the SpeckleServer.
The diagram below shows a schematic view of the Speckle ecosystem (Figure 26). An end application, such as Rhino or Dynamo, in order to communicate with a SpeckleServer, will incorporate a relevant API client. Specifically, in this case, SpeckleCore, as it is based on the .NET platform, same as the example host applications above. This API client will, subsequently, call the server’s REST API endpoints, which are described in more detail in the following section. Herein, calling entails passing any data required to perform the given operation. Subsequently, the server parses and validates the data it received. If everything is in order, it is persisted to (or retrieved from) the storage layer, in this case MongoDB (discussed in the following section, namely 5.3.3).
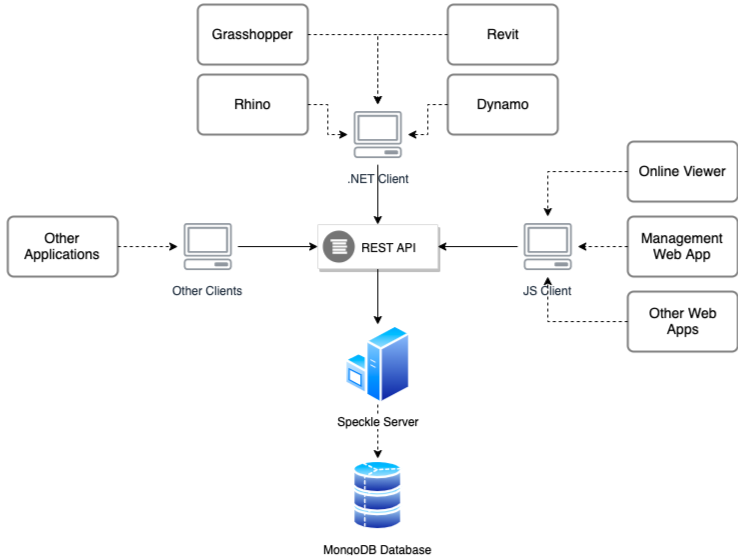
Figure 26: Speckle platform high-level architecture.
It is important to note that, from a web-centric view, Speckle can be divided into the “Backend”, consisting of the SpeckleServer and the database, and the “Frontend”, consisting of various end-user facing applications (e.g., CAD plugins or web apps). The application layers presented above can be deployed on different hardware, independently of each other (n-tier architecture) or one single machine (tier-1). Further to be discussed in Section 7.4 of the Discussion chapter, while a given instance of the SpeckleServer is a locally central entity, because it can be deployed multiple times by multiple actors, at a higher abstraction level, it is a node in a decentralised network. This is because the clients are not restricted in their interactions to one given SpeckleServer at a time and can connect to multiple ones simultaneously, essentially acting as bridges between instances (Figure 27).
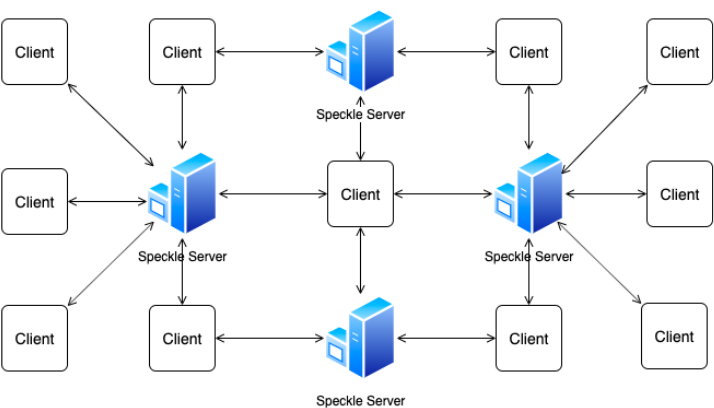
Figure 27: Decentralised network of Speckle instances and clients.
5.3.2 API Specification
The Speckle Server’s REST API was documented (specified) using the OpenAPI v.2.0 (Swagger) specification language. The remit of the specification encompasses the platform-agnostic definitions of a set of REST endpoints for the basic CRUD (Create, Read, Update, Delete – the four basic functions of persistent storage) actions that the SpeckleServer subsequently implements. These actions will be called by the various front-end application clients, such as the one described in the following section. The code sample below shows how such an action is defined, namely the ObjectCreate endpoint. Specifically, it defines at what URL endpoint the server will accept calls for this action (/objects), what kind of action this is, via the HTTP verb (“post”), an operation id (ObjectCreate) by which one can refer to it consistently throughout the various parts of the ecosystem, operation parameters (in this specific case, an array of SpeckleObjects), and a set of possible responses (“200” for a successful operation, “400” for an error).
const winston = require( '../../../config/logger' )
const BulkObjectSave = require( '../middleware/BulkObjectSave' )
module.exports = ( req, res ) => {
  if ( !req.body ) {
    res.status( 400 )
    return res.send( { success: false, message: 'Malformed request.' } )
  }
  BulkObjectSave( req.body instanceof Array ? req.body : [ req.body ], req.user )
    .then( ( objects ) => {
      res.send( {
        success: true,
        message: 'Saved objects to database.',
        resources: objects.map( ( o ) => {
          return { type: 'Placeholder', _id: o._id }
        } ),
      } )
    } )
    .catch( ( err ) => {
      winston.error( JSON.stringify( err ) )
      res.status( 400 )
      res.send( { success: false, message: err.toString() } )
    } )
}
Figure 28: Implementation of the CreateObject POST endpoint.
/objects:
  post:
  tags: ["Objects"]
  summary: ObjectCreate
  operationId: ObjectCreate
  description: Create one or more objects
  parameters:
    - name: objects
      in: body
      schema:
      type: array
      items:
      $ref: '#/definitions/SpeckleObject'
  responses:
    '200':
      description: All the users's projects.
      schema:
      $ref: '#/definitions/ResponseObject'
Figure 29: OpenAPI specification of the CreateObject POST endpoint.
The above describes the “Create” action (Figures 28 and 29); the “Read”, “Update” and “Delete” actions are similarly specified. The full SpeckleSpecs contain several more groups of endpoints for actions pertaining to creating accounts, projects, and comments (that are not covered in this thesis). Nevertheless, the following section shall discuss in more detail the database structure and introduce a new schema for a collection of SpeckleObjects, namely a SpeckleStream, which will serve as the basis for a convenient flat logical grouping of design objects that is easy to reason about.
5.3.3 Database Model
The MongoDB database system, as it is, can store object information without regard to their structure. Nevertheless, this approach does not scale well after a certain amount of data and/or users, as the efficiency of later on querying the system is reduced drastically on fully unstructured collections. Consequently, Speckle employs a structured approach that attempts to strike a balance between flexibility and rigour.
Subsequently, the database is structured in several collections (or tables, as they are known in SQL), the relevant ones for this discussion being DataStreams, SpeckleObjects, Users, and UserClients. Each collection will hold only its specific type of object, and perform minimal data validation to ensure the consistency of the persisted information. Particularly of interest is the relationship between DataStreams and SpeckleObjects: the former collection stores exclusively objects of the SpeckleStream type; the latter holds, essentially, all the SpeckleObjects themselves.
A SpeckleStream’s schema specifies an array named “objects”, which stores a list of database ids that reference objects in the SpeckleObjects collection. This approach allows for one object to exist in multiple streams, which is particularly useful in scenarios in which a user shares two overlapping sets of design objects. The UserClients collection keeps track of objects that define where a SpeckleStream originates from and where it is subsequently received; they will be discussed in more detail in the following chapter. The diagram below describes the relationships between the various collections (Figure 30).
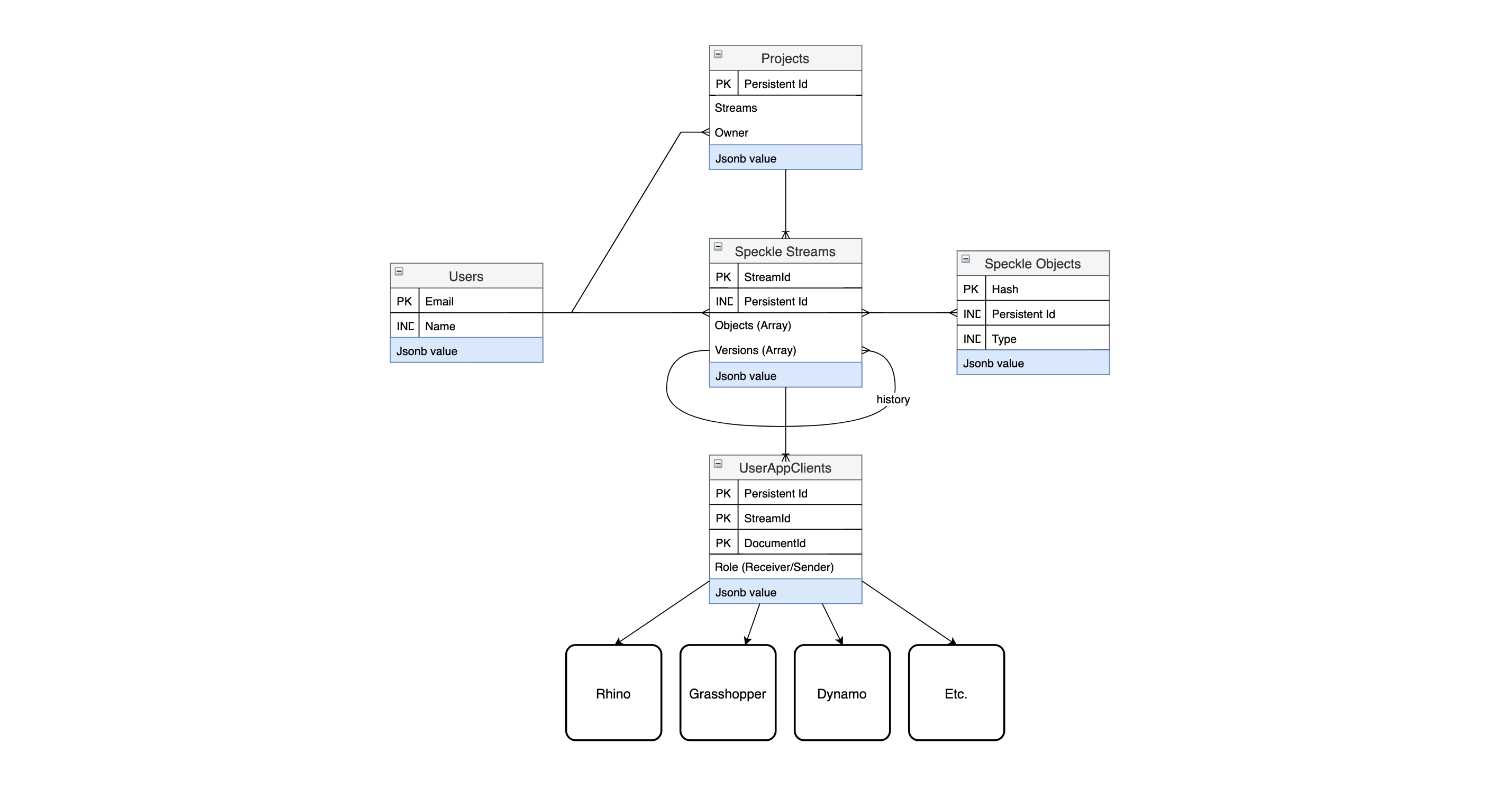
Figure 30: The Speckle database model, showing a simplified view of the collections (tables) and relationship between them.
The actual data model is more complex than the one presented above, nevertheless for the purposes of illustrating the basic functionality of Speckle it suffices. An important factor in the design of an object-oriented database is defining the indexes of a collection, as this is the primary mechanism by which data is retrieved, sorted and classified. Consequently, the SpeckleObjects collection is indexed by their primary _id, their hash as well as by their type. The SpeckleStreams collection is indexed by its shortId field (which is a unique five letter and number key provided for ease of reference), as well as by its owner. These additional indexes allow for queries based on them to operate at the same level of efficiency as they would in a traditional SQL database, without a complete table re-scan.
As the previous chapter has shown, a SpeckleObject may be composed of many other different sub-SpeckleObjects. There are two different approaches that can be taken in this scenario regarding the way they are saved in the database. The first is to ignore their composition and simply save it as one document that encompasses all other documents. The second approach is to recursively unpack all the sub-objects and save them as separate documents, and relink them based on their database references or unique hashes. The second approach is more efficient in the long term with regards to the amount of storage resources. Nevertheless, it places an extra burden on the server when it comes to retrieving information, as the number of reads necessary grows linearly with the object's composition depth (each sub-object needs to be read individually from the database and recomposed into the parent object). During this research project and the evolution of Speckle, both approaches to object storage have been implemented, nevertheless only the former remains in active use due to constraints on both developer usability as well as code maintainability.
5.3.4 The Speckle Server
The API is implemented as a stateless multi-threaded Node.Js server that respects the contract embodied by the SpeckleSpecs. Beyond providing the means to create, read, update and delete SpeckleObjects, the server application also handles various security concerns, such as encryption, and, most importantly, user accounts and permissions. A detailed discussion of these aspects is beyond the current scope of this investigation.
The technological stack used to implement the REST API relies on the Express framework. This is used to define the URLs at which software clients can thereafter call the specific methods, for example POST /api/v1/objects is used for saving into the database one or more SpeckleObjects. Specific idempotent handling functions for these operations are subsequently written as separate application controller files. The authentication of end-users is handled via the Passport module via the standard, well used and tested strategy of username (email) + password[26].
Previously, it was mentioned that having a stateless server is important for infrastructural scaling purposes; this is achieved through the use of expiring JSON Web Tokens (JWT) which are provided to clients upon a successful authentication. For communication with the MongoDB database, Speckle relies on a higher-level driver, namely mongoose, that simplifies some of the operations involved as compared to the native NodeJs driver.
5.3.5 Application Integrations
The SpeckleCore library is subsequently extended with a series of methods that can call the API exposed by the SpeckleServer; these methods are grouped with a SpeckleApiClient partial class which is generated directly from the SpeckleSpecs using, as in the previous chapter, NSwag (Suter, 2018). These methods allow for the interaction between the client application with the persistence layer (a MongoDB database), mediated through the SpeckleServer. The SpeckleApiClient class is further extended to add several convince methods that inject in every server request the user’s authentication token, if one is present, as well as compress the informational payloads being sent to server.
Consequently, the application integration between Speckle, Rhino and Grasshopper is extended to allow users to persist design data, as well as receive it. The Grasshopper integration consists of two components, namely the SpeckleSender and the SpeckleReceiver (Figure 31). The sender component, when instantiated, creates a new SpeckleStream that is subsequently populated with the objects that a user connects to it. The receiver component, once provided with a SpeckleStream’s shortId property, will retrieve all the objects thereby present from the database. Whenever the input of a SpeckleSender changes, the objects are saved to the persistence layer and subsequently the SpeckleStream is updated automatically.
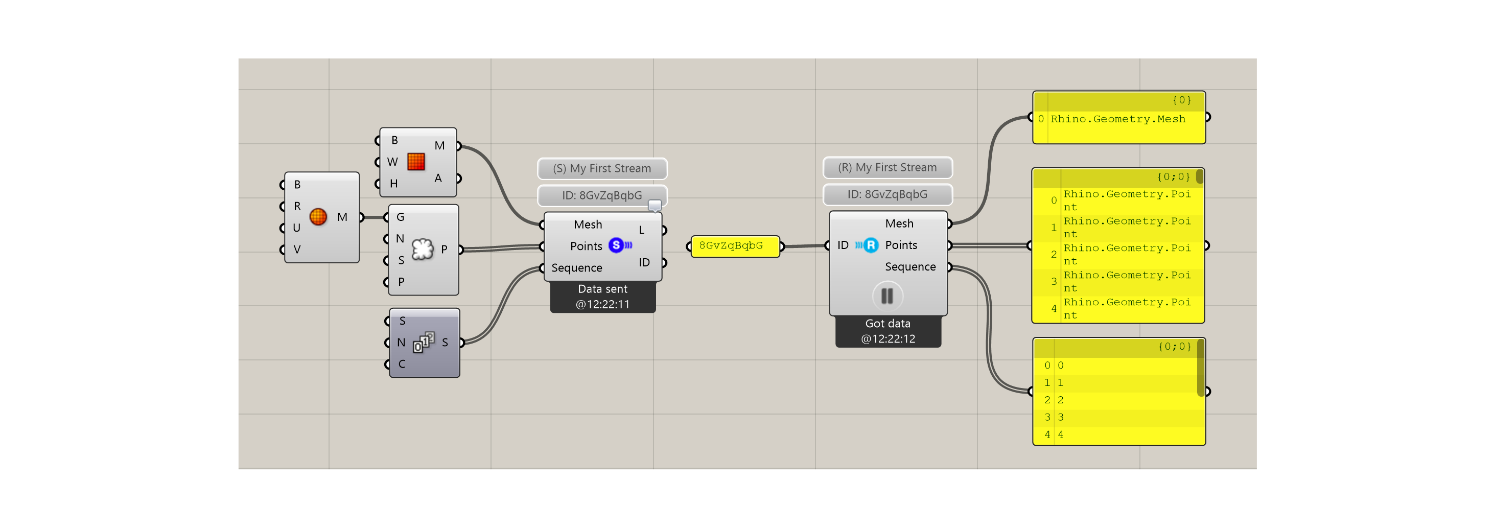
Figure 31: Grasshopper Speckle Sender (left) and Speckle Receiver (right).
While in the programmatic environment offered by Grasshopper the approach was easily determined based on already existing user interface constraints, the direct to Rhino integration required special handling. Together with Luis Fraguada from McNeel Europe (one of the InnoChain industry partners), the author has developed a basic user interface that exposes the send and receive functionality in a quasi-similar way to the already present “layers” interface present in Rhino (Figure 32). It allows users to create SpeckleStreams from an initial selection of objects from the file currently being open, as well as adding or removing other objects later on. Similarly, as the Grasshopper clients, it tracks the objects assigned, and, if changes are detected, it will automatically update the SpeckleStream’s state.
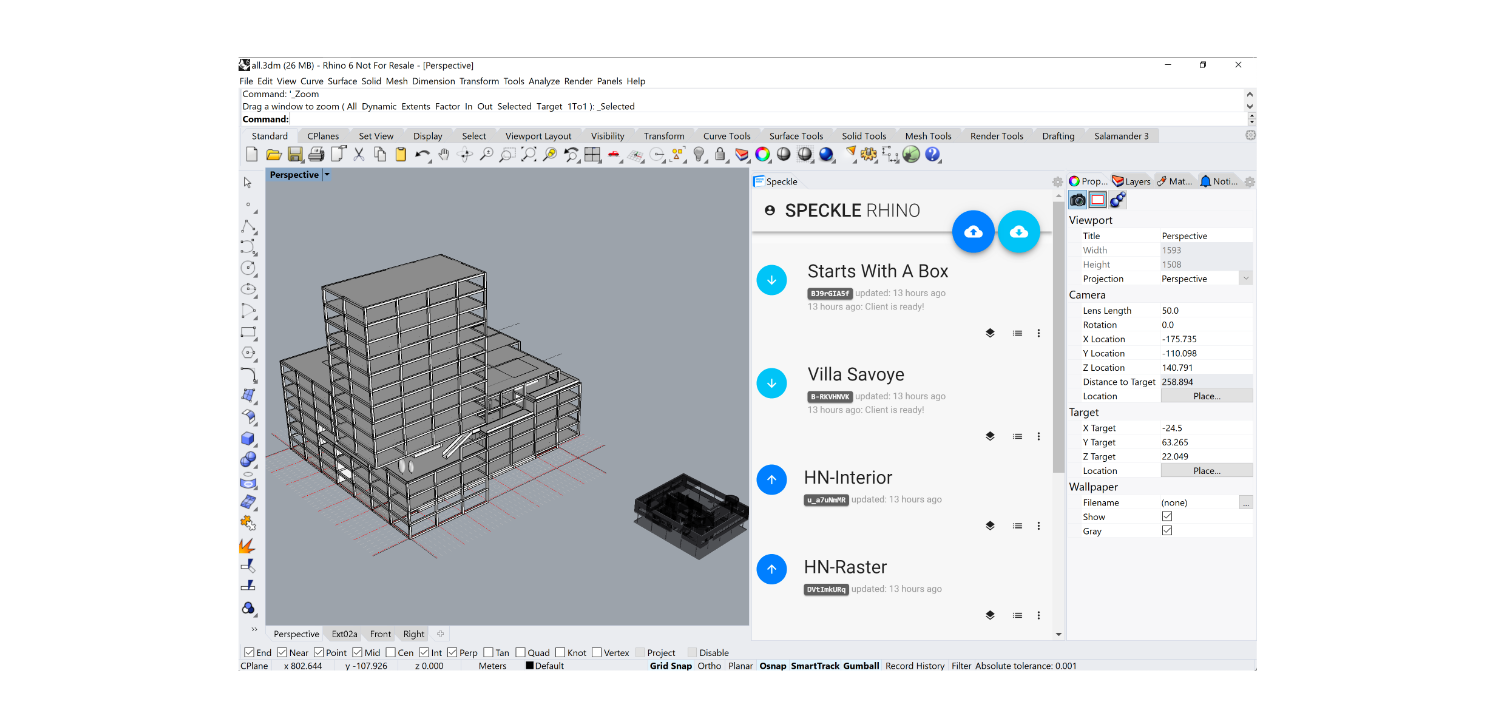
Figure 32: Rhino Sender (dark blue) and Receiver (teal).
The SpeckleRhino interface is functioning independent of Rhino itself and communicates via a special class that handles passing messages between the two layers. This allows for its reuse in other applications, for example Revit. The reasoning behind this architectural and technological implementation is anchored in the need to provide a consistent user experience across multiple software packages, as well as other technical concerns, such as cross-platform compatibility.
The automatic detection of application state changes and subsequent updating of the database can be disabled (paused), or further refined to enable different interactional possibilities for end users. For example, instead of automatically sending updates, one could require a direct user action, such as a button click, and a description message to be written by the user that explains or justifies the changes being made, as in the case with source code version control software.
5.4 Object Identity, Immutability & Data Deduplication
The previous chapter showed that the inferential approach to design data encoding and decoding results in a process that is not symmetric, or in other words, information is changed throughout the process of communication. At a superficial glance, one would conclude that it is therefore impossible to maintain consistency, or a pertinent state of truth within such a system. Nevertheless, the following section will show how one can provide a consistent and rigorous system that bypasses this issue by ensuring the immutability of SpeckleObjects at the storage layer and, at the implementation’s programmatic level, not allowing simultaneous edits from two different sources of the same object collection (SpeckleStream).
Immutability is the property of an object whose state cannot be changed after it has been created. A corollary formulation can be seen as if one modifies the properties of an object, it becomes a new object. Consequently, a new way of storing design data that takes this into account is put forward: whenever a user persists new objects to the database, old ones are never overwritten. This describes an “only forward” approach. In order to do so, one needs a way of efficiently checking whether an object changed and is now a new one, or it’s still the same; in other words, Speckle needs a consistent way to uniquely identify objects.
When stored in a database, each object gets assigned a unique identification. These are stored under the _id field and serve as primary indexes for that collection. Similarly, at the application layer, each object has a unique address or reference pointing at a specific location in the stack or, in the case of SpeckleObjects, the heap where its information is stored. Nevertheless, these unique identifier keys are assigned randomly by the system at hand and do not reflect on the actual properties of the object itself; as such, there is no way quick of knowing whether one object is the same as another without comparing its properties and fields one by one. In order for this approach to be viable, a faster and easier way is required to ascertain and track object identity in order to ensure their immutability.
However, the object’s hash provides an efficient way to ensure a consistent, non-random and immutable approach. As discussed in Section 4.1, Composable Data Structures, each SpeckleObject has to have a unique hash (digest) that is directly dependent on its value and should change whenever any of its properties change. For example, a simple point object with its coordinates at (0, 0, 0) will have a different hash value than one with its coordinates at (0, 1, 0)[27]. There is a secondary hash, namely the geometryHash, which operates the same way, but its value is not dependent on a SpeckleObject’s custom user added fields. This allow us to later on diff[28] objects at two levels, a holistic one, and a purely geometry-information based one, which enables certain optimisations with regards to the size of a transaction. Subsequently, one can ensure that information loss does not occur: even if the information transmitted through the system is being changed by the contexts in which it is received, one will always have a record of the state it originated from.
Furthermore, this has the benefit of allowing us to not store duplicate objects. For example, consider designer Mary using a large site model for a building project that was made previously by the surveyors. If she will save this model to the database, assuming it is only one object, it will subsequently be stored under its unique hash. John, Mary’s colleague, uses the same model, and will save it as well in Speckle’s database. Nevertheless, because the site model’s objects hashes are already present, the SpeckleServer that mediates these interactions will detect and prevent saving them twice. This amounts to data deduplication based on object fingerprinting (their hashes) and greatly increases the efficiency of the framework in dealing with system resources.
As a technical implementation detail, this same mechanism is employed on the client side through the use of a local cache that keeps track of what objects have been previously successfully persisted on a given Speckle server. This allows to pre-empt the transaction between a client and the server of a previously persisted object: instead of sending the duplicate to the server, the client can already cull it beforehand and only pass its reference if needed.
The behavioural picture of the system is completed by discouraging the simultaneous editing of SpeckleStreams (object collections). Essentially, one can update a stream only from the original context or source it has been created. Nevertheless, this rule is not enforced at programmatic level within the core application layers—it is merely a convention of the end-user facing plugins of the instrumentation. At the receiving end, if one needs to modify the information received and send it back to the other communicant, one first has to pull the associated objects into the host application. After modifying the objects, the end-user will create and save a new SpeckleStream that contains the modified data. Subsequently, this new SpeckleStream can be received by the original party. It is important to note that, whenever an end-user creates a SpeckleStream, it is stored in the SpeckleServer’s central database, together with its constituent SpeckleObjects. These can be subsequently received by other end-users and not just one single recipient, leading to the creation of a “human”-based directed graph. The diagram below shows a schematic view of the process described above, first from the point of view of only two users exchanging information through two streams (Figure 33), and thereafter expanding to incorporate multiple streams and actors (Figure 34).
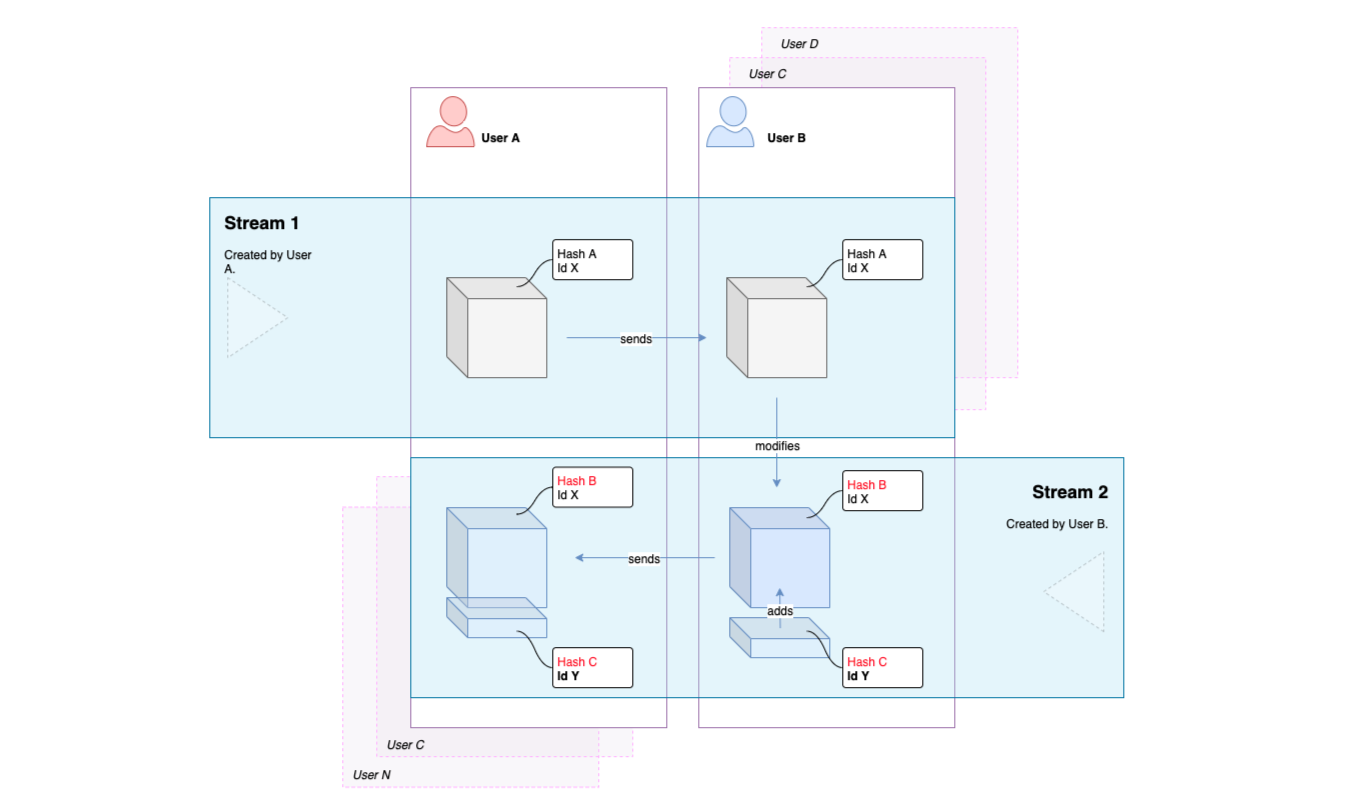
Figure 33: Diagram showing a feedback loop between two users working on the same geometry: A, via stream 1, sends to B an object. B modifies the object, and sends to A, via stream 2, her or his proposed changes.
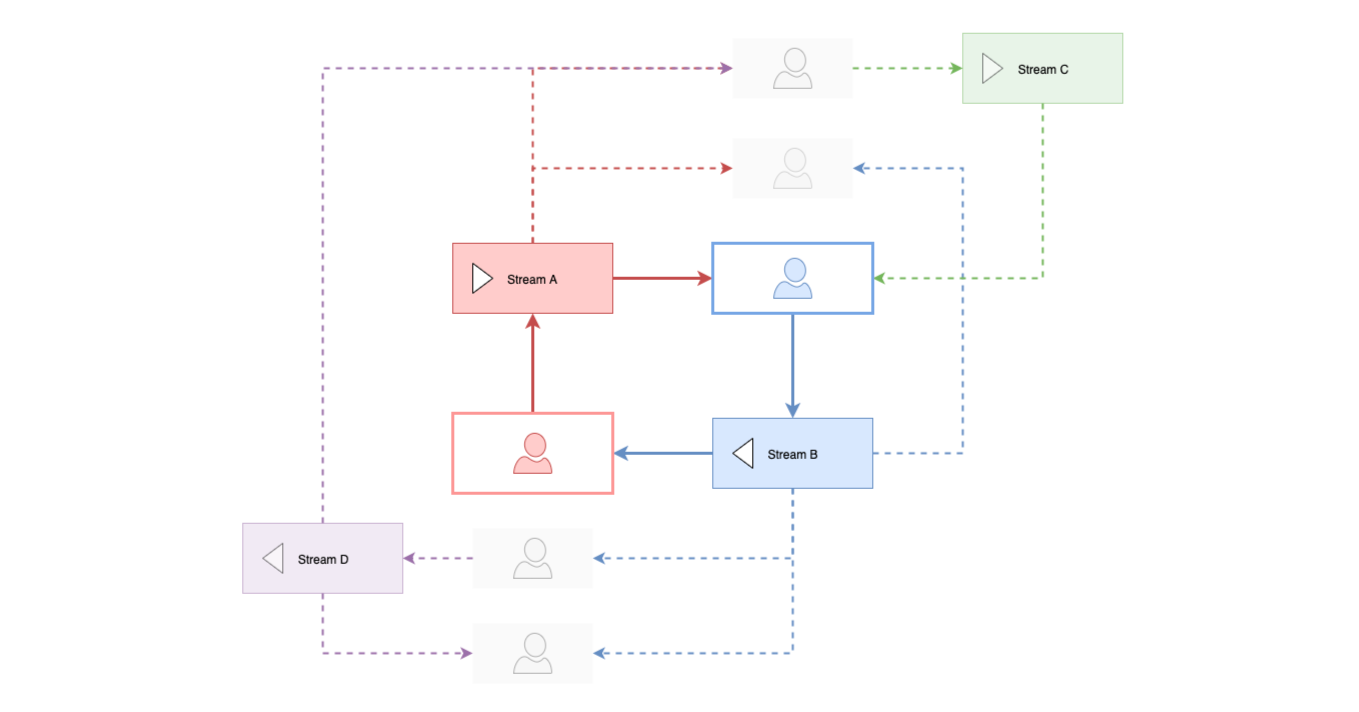
Figure 34: Expanded diagram showing the interactions between multiple actors and SpeckleStreams, and the emergence of a communication network in the shape of a directed graph. Stream A is being received by three different users. These users create new streams, some of which reach back to the original sender and influence the data being sent in Stream A.
While the lack of concurrent editing can be seen as limitation, it is an extremely productive one if respected[29]. Productive social dialogue does not happen concurrently, in other words communicants do not all speak at the same time; conversation, as Garfinkel and others put it, implies an ordered sequence of informational transactions that build on top of each other. Speckle, first and foremost, aims to enable the same process at the level of digital infrastructure for design communication. The transactional aspects of design data communication, and how their quantitative qualities, such as transaction size, reflect on its progress and the overall framework architecture, will be analysed in detail in the following chapter.
5.5 Data History
Having a historical record of what information has been communicated is an important requirement that emerged from the interactions with industry. In a file-centric approach, this is usually a wasteful process that requires keeping multiple copies of the design models being produced throughout time. Besides the logistical difficulties of keeping track of each version, the process does not allow easy comparisons between the stages thus archived. Nevertheless, based on the approach described above, this section describes an efficient way of storing design data state through time. This can happen on two levels, either object-by-object, or object collection by object collection.
5.5.1 Object Level Tracking
Object history is feasible only in cases where one can map a common identity between Speckle’s persistence layer and the application that produces the object itself. As such, this excludes objects that are produced by a parametric model[30], either from Grasshopper or Dynamo: by being in continuous flux, they cannot be related to their “past” instance. For example, consider a component that produces a set of random points in a three-dimensional volume based on the desired number and the desired rectangular volume that needs to be populated: each change in the inputs will generate a different output that cannot be related to a previous one, as there is no object-level consistency, only at a generative level one can identify a constant identity (the function itself).
Nevertheless, in the case of objects that are produced by end-users in a non-programmatic manner, history can be traced. For example, consider a mesh, object A, with a given application id[31]. The designer, after initially modelling it, proceeds to modify it in a certain way, which, when encoded into a SpeckleMesh, will receive a different unique hash, thus being transformed into object B. Nevertheless, the application id of both object A and B is unchanged, allowing us to identify a relationship of kinship between the two.
5.5.2 Stream Level Tracking
Given the fact that object level information is decoupled logically from the object collection itself (the SpeckleStream), storing versions of its state, at a given point in time, becomes computationally cheap. As such, every change in the composition of the SpeckleStream’s object array can be stored and retrieved later, as a child of the original. For example, consider an initial set of three objects, A, B and C, that are being persisted in a given SpeckleStream. The user, through subsequent modelling operations, removes object B and replaces it with two other objects, D and E. The original state has a SpeckleStream composed of A, B, and C. After the modelling operations, it will contain A, D, E and C.
Because the SpeckleStream itself keeps track only of the references to objects it is composed of, storing a reference of its historical states does not imply duplicating the data of recurring objects; as described previously, only unique objects are saved in the database. The actual cost of storing a record of a stream’s state at a given point in time amounts to simply storing a new array of object references. If the state is composed only of previously existing objects, it can be negligible.
The approach described herein is just a skeleton on which future functionality can be built. The way the history mechanisms of the storage layer can be exposed is flexible: for example, one can envision a fully version-control like system being developed and consequently implemented in the presentation layer. Another, more pragmatic and easier to implement, way is to simply enable design “versioning”, in other words allowing actors to save the state of a given SpeckleStream as a design variant, or option, without necessarily seeing it as part of the more complex version control tree. To a certain extent, both systems require users to be able to compare the changes between one or more states, which is implemented as a special route on the SpeckleServer’s API. The change detection algorithm currently implemented compares the object array of two different SpeckleStreams (say, A and B) and returns three separate lists of objects that represent the intersection of the two sets, as well as the difference between each of them (A ∩ B, A - B and B - A). In other words, they correspond to “objects in both A and B”, “objects only in A” and “objects only in B”. If B was a newer version of A, this operation essentially reveals the unchanged, deleted and added objects.
Further to be discussed in the following chapter, Data Transaction, the same mechanisms are employed also by the client application integrations to optimise transaction payloads, as well as by the server to remove data duplication. It can be seen as a way by which technical communicants—the code itself—leverages the system’s memory of previously persisted data, to the extent it is aware of it, in order to optimise the relevancy of the information being transmitted: the immutability and “only forward” storage layer, that has been introduced previously, when taken together, not only prevent transactional data loss, but simultaneously allow for the coherent aggregation of a historical record of communication.
5.6 Case Studies
As mentioned in the Methodology chapter, the Speckle framework has been continuously exposed to feedback from the industry and the InnoChain project partners throughout its development. Consequently, the approach described in this chapter is a direct result of its usage and specific case studies are difficult to extract as independent experiments. Nevertheless, in the following section, several scenarios are presented that highlight the affordances provided by increased flexibility of design data classification, as specifically implemented in Speckle.
5.6.1 Curating Data
Dialog Design, a large multi-disciplinary design company based in Canada and North America, has been using Speckle at the core of their digital design data communication processes. One of the ways they employed the framework was to enable the integration of simulation early on in their design process. They did this by having an energy analysis tool running on a VDI farm and directly interfacing with the SpeckleServer to provide almost real-time sustainability analysis (under 30 seconds) on a design model. At the core, this integration relies on having two SpeckleStreams, one embedded as a sender in the design model through which the necessary information would be sent to the analysis server, and a second one carrying back the information from the analysis back into the design model.
Dialog Design’s approach relied on curating from an architectural model the specific information needed for performing the analysis. In this case, they sent just the building envelope (outside massing shape) as one independent collection of objects (SpeckleStream). Subsequently, they retrieved the data produced by the environmental analysis software and matched it back with the original model via a separate SpeckleStream. Based on these results, they were able to inform further design decisions on the volumetric and orientation of the building being designed.
A further application of the Speckle framework inside Dialog was in the field of building programming. Building programming is a complex task in which one has to match specified desired surface areas for the various functions that a given building has to incorporate with their geometrical constraints, often expressed in terms of accessibility and connectivity (for example, a requirement can be formulated as the back-offices of a municipality building—300m2—need to have quick access to the archives—2000m2, underground placement). Dialog devised a workflow for optimising this process for existing buildings: (1) from Revit, where the original building model is defined, area plan outlines are selected and persisted to a SpeckleStream; subsequently, (2) they are retrieved in Grasshopper, where an evolutionary optimisation algorithm devised is being run to search for the best possible building programme association. Once a satisfactory solution is found, it is being stored in SpeckleStream and subsequently retrieved in Dynamo and used to generate the associated layouts in Revit (Figure 35).
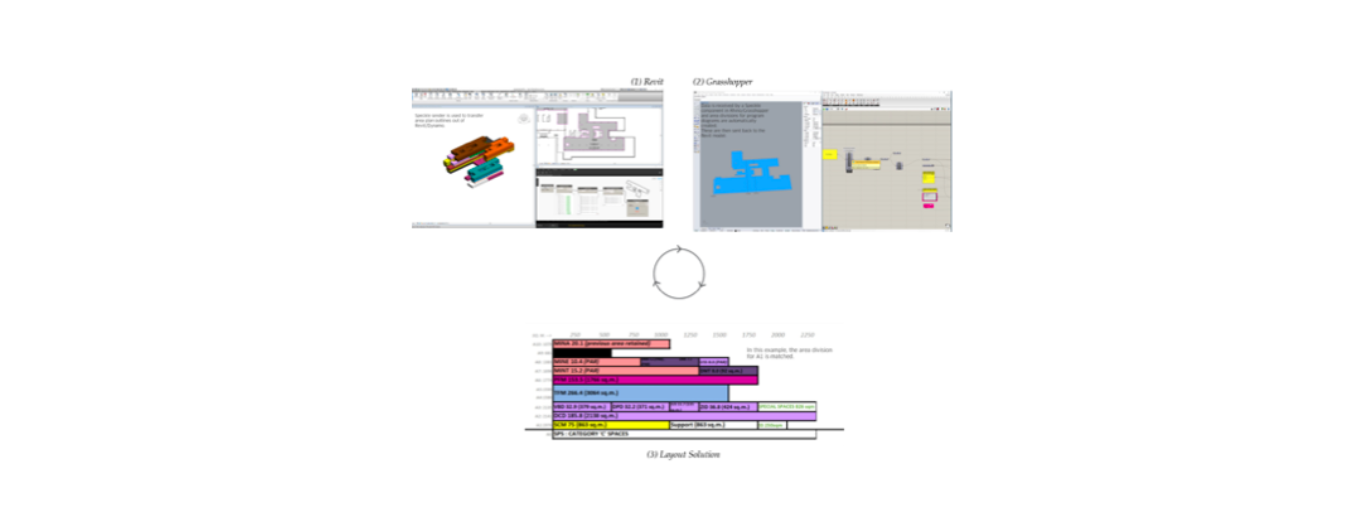
Figure 35: Shows the process behind Dialog’s building programming optimisation workflow. Image rights: Mark Cichy & Dialog (2018).
Another example coming from the industry usage of Speckle comes from Aurecon, a large general contractor. In order to showcase the company’s forward looking digital ambitions, they staged a fully integrated design-to-manufacture workflow of a sculpture wrapping around an existing column. In this specific example, Speckle played a central role in the data transactions involved in the process.
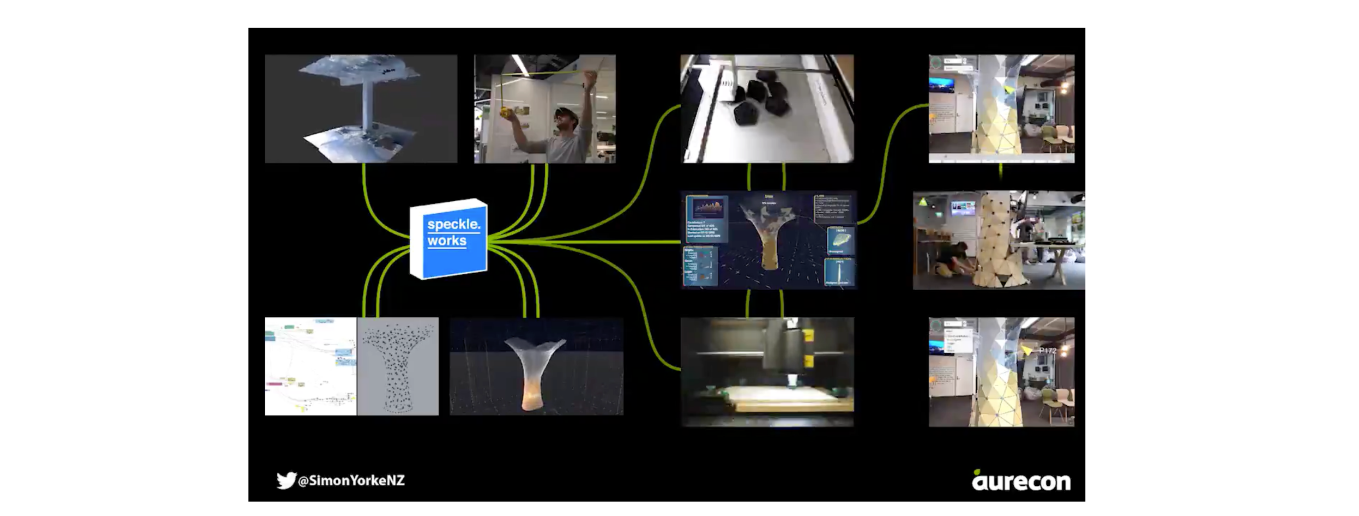
Figure 36: Still from Simon Yorke's video describing the workflow enabled by Speckle. Image rights: Simon Yorke & Aurecon (2018).
The full workflow consisted of using 3d scanning to capture in as much detail as possible the site of the intervention. This information was used thereafter as the basis for a parametric model of the designed object. This parametric model was articulated in such a way that it allowed for aesthetic variation, while at the same time constraining the geometry within the fabrication parameters (specifically, 3d printing for joints and laser cutting for the wooden panels). The model was evaluated visually in virtual reality through a custom developed unity application. It was simultaneously evaluated for manufacturability and structural rigidity by different applications running parallel.
Throughout the process described above, Speckle was used to propagate the required information for the various subtasks of the workflow (Figure 36). Specifically, from the parametric model, two several separately curated data sets were transmitted: one for structural analysis, and one for visualisation within the virtual reality environment. From the structural analysis software, a different data set—containing just the deformation results—was used to inform design decisions. Lastly, two different other streams were used to curate the manufacturing of the joints between the wooden plates, and the wooden plates themselves. These were retrieved on two different corresponding computers that were controlling the 3d printer and the laser cutter.
Summarising, the workflow described above leveraged the potential to efficiently join multiple processes through lean, curated data sets. If this workflow were to rely on files, the overall speed and efficiency would have been compromised, as any design change would have implied a time consuming re-export and re-evaluation. By curating for each sub-process just the data that it requires to perform its task, Simon Yorke, and Aurecon, were able to assemble a real-time feedback loop between design, analysis, and, as an ultimate step, manufacture.
5.6.2 Staging Workflows
Another case study was staged at the SimAud 2018 conference, as part of a day long workshop given by the author together with Paul Poinet, a fellow InnoChain researcher, at the TU Delft Faculty of Architecture. The workshop’s goal for the first half of the day was to enact a digital design workflow between several stakeholder roles in a design office: planning, architecture, analysis and reporting. This was achieved through two exercises, a guided one in which each individual team’s role and model was defined in advance, and an unguided one. The former was based on the multi scalar modelling process of an entry for the Tallinn Architecture Biennale pavilion, originally designed by Paul Poinet and Tom Svilans. Participants were split into teams, each controlling various aspects of the design (Figure 37): (1) master surface, (2) branching network, (3) network optimisation, (4) glulam blanks generation and (5) lamella generation.
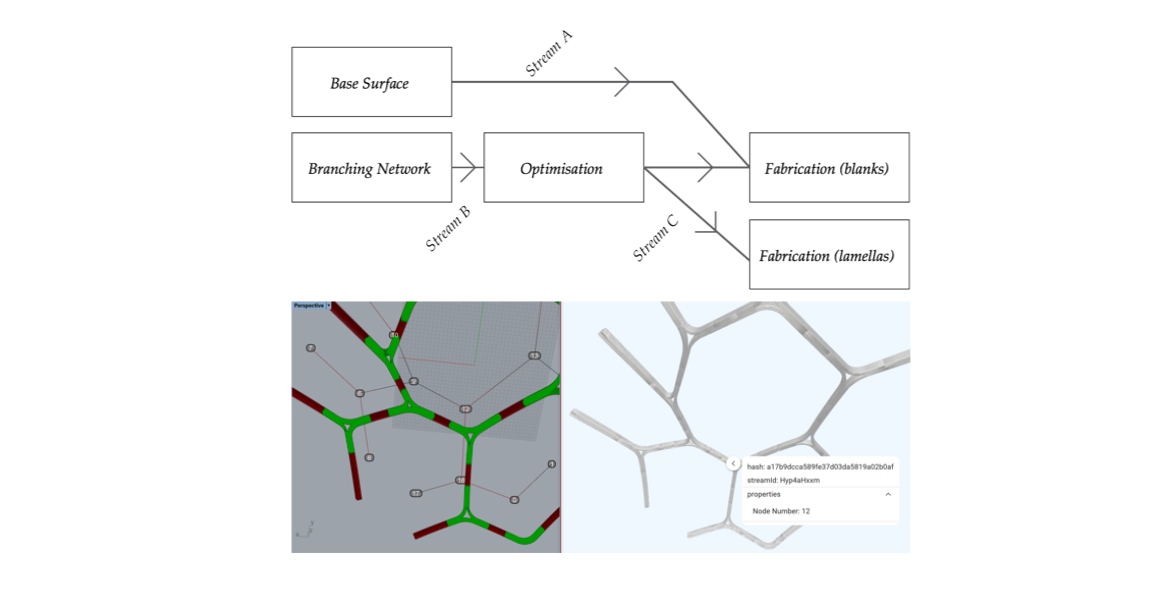
Figure 37: TU Delft SimAud 2018 guided exercise workflow map (above) and actual resulting model (below).
While the guided exercise aimed to familiarise the participants with the basics of a multi-model approach to design data exchange, the unguided example did not provide a predefined organisational structure of the workflow. It proposed an exercise that entailed the conceptual design of three airport structures, namely two terminals (T1, T2) and a central mobility hub (T3) interacting with both; the surroundings model was provided beforehand via an initial SpeckleStream. While initially split into three teams, communicative exchanges evolved continuously throughout the limited time dedicated to this exercise (Figure 38). For example, in the case of T1 needing to coordinate with a specific design element coming from T3, a person working on T1 would ask “can you send me the access points to the underground level of the station?”, moment in which the person from T3 would select from his model the specific design data relevant and create a new SpeckleStream specifically for the person from T1. Within the teams, similar exchanges ensued as the participants divided tasks amongst themselves, such as “can you send me the exterior envelope so I can do the façade panelisation?” or “I need the slabs of T2 to make sure the levels match with T1”, etc.
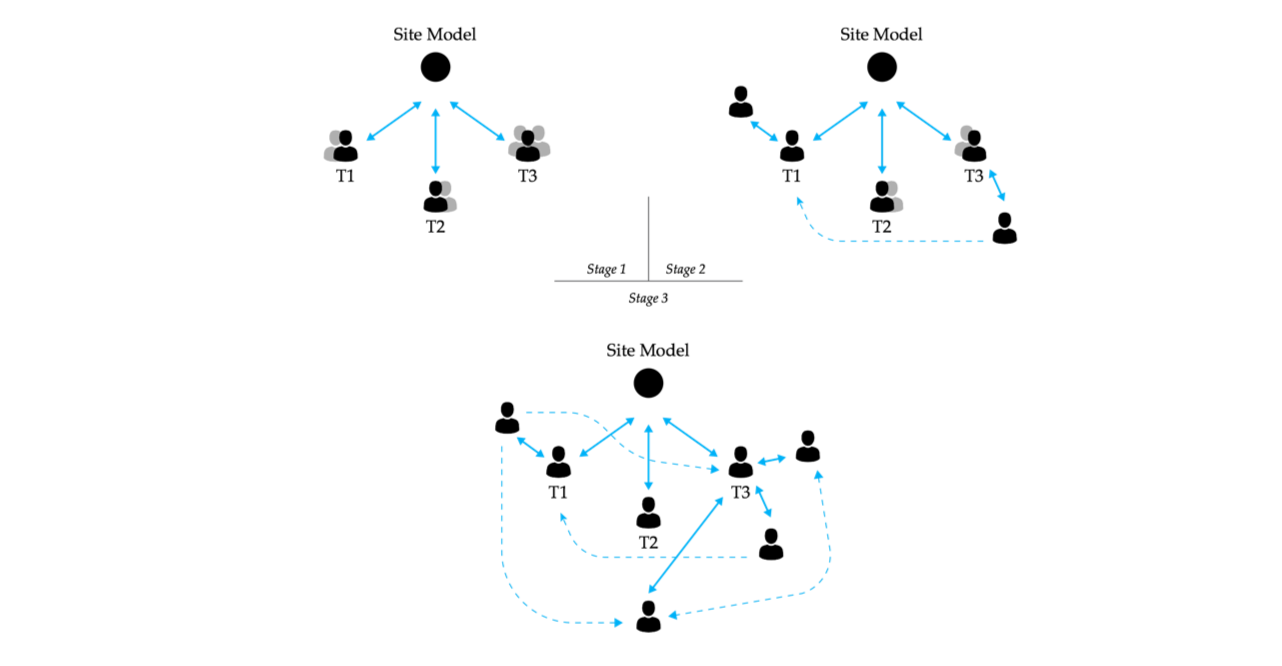
Figure 38: Diagrammatic representation of the evolution of the communication flows during the unguided exercise of the workshop.
Other communicative exchanges were enabled through the composition of ad-hoc defined queries and projections on the SpeckleStreams being shared. The SpeckleServer supports filtering a collection of objects based on their properties and sub properties in order to allow for retrieving new sub-classifications that are user defined beyond the initial grouping embodied by the SpeckleStream. Essentially, a query can be seen as a request to the server to return only the objects matching certain criteria; for example: “from stream X, please return only the objects of type `Curve` with an `area` property larger than 120”, or “from stream X, please return only the objects with a `level` property equal to `+0.5_lower_basement`”. Furthermore, a projection allows for the user selection of the fields returned. For example, if one actor would be interested in just general costing, he would request that only the “area” and “volume” fields of the objects would be returned, if present. These mechanisms were used to produce some simple quantity reports during the workshop by importing a set of such queries and projections in Excel, whereby total project areas could be centralised and costed.
5.7 Observed Classification Patterns & Performance
Mining the data from the database behind the experimental public test SpeckleServer, Hestia, further informs the nature of the emerging object-based classification patterns that the object-based methodology described in this chapter allows. The collected data allowed us to derive statistics on the amount of subdivision in a given file, or model. Throughout this section, the terms model and file are used interchangeably.
5.7.1 Model Subdivision & Reassembly
The chart below shows the distribution frequency of sources and receivers per unique model (Figure 39). In order to cross-reference the data needed for this analysis, the database was queried for the number of SpeckleStreams originating from each model (black), for the number of SpeckleStreams being received in that model (red), and the combined number of sources and receivers (red). Finally, this dataset was partitioned into finite amount of frequency bins, spanning sequentially from one to twenty (i.e., models with one source, two, three, …, twenty; same for models with one received stream, etc.) and models with more than twenty sources (and, separately, received streams).
An important caveat is that the data underpinning the following observations is limited by the fact that the Speckle plugins, in order to track these distributions, rely on the host application reported document UUID (or equivalent). This is not fully accurate, as some application APIs do not expose a method for retrieving it and, as a consequence, the plugins fall back on the file’s name. Furthermore, in the case that the file is not yet saved (it is newly created), a default value of “unnamed” is used as a document UUID, and such instances were removed from the data used in the analysis.
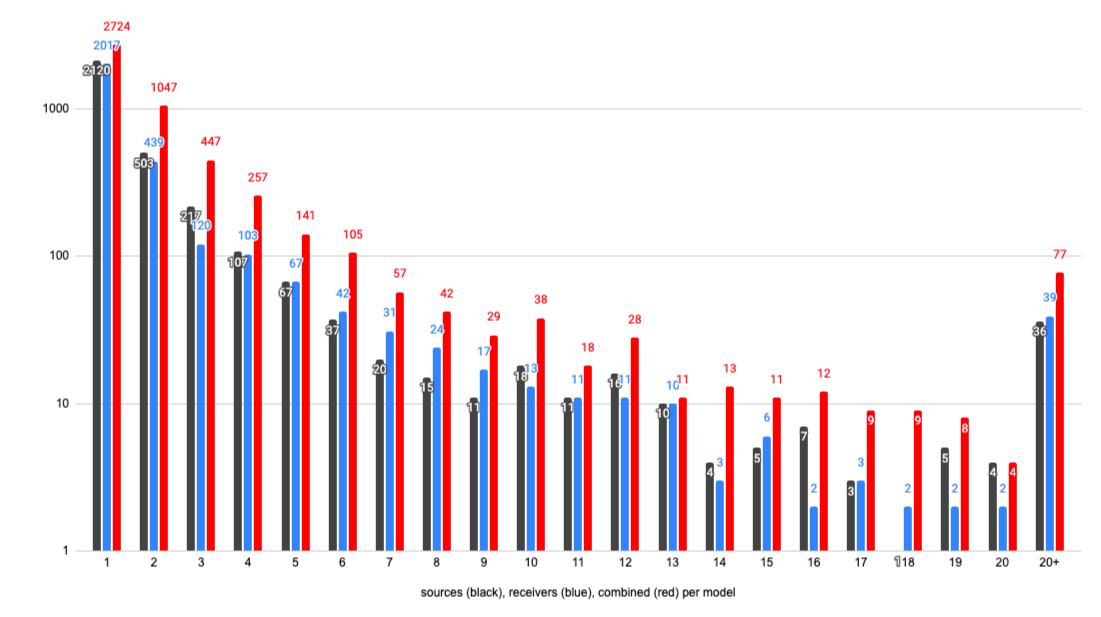
Figure 39: Distribution of senders (black), receivers (blue), and both (red) per model. Vertical axis: number of models (logarithmic scale).
This chart shows a strong presence of models with only one SpeckleStream being sent, nevertheless with the majority of models originating in the range of two to ten different SpeckleStreams. Similarly, the majority of models receive two to ten different SpeckleStreams. The combined metric (sources and receivers per model) shows a similar distribution to the previous two.
This specific dataset is revealing a cohesive picture of how models are subdivided into different classifications and then subsequently regrouped into other files. The dominant one source/receiver per stream frequency score can be interpreted in three different ways. First, it can be seen as a mirror of the current de-facto approach employing monolithic files. Second, as a signal that approximatively one third of the design files do not need to be subdivided into more than one classification; in other words, they are already representing a productive categorisation that is self-sufficient. Third, that the model contained relevant data to other stakeholders that warranted only one classification—the rest being locally relevant information from either a technical point of view (in other words, software-specific “scaffolding”, geometric modelling helpers, etc.) or domain specialised data with internal meaning only.
| Streams sent per model | Streams received per model | Combined | |
| Average | 2.47 | 2.29 | 2.78 |
Figure 40: Distribution of sources per model.
Overall, the mean value of senders per file is 2.47, while the average number of receiving streams per model is 2.29 (Figure 40). This shows that on average, re-assembling different data sources is almost as prevalent within the design process as sub-classifying it into different logical groupings. Lastly, combined, the average number of data sources per model, irrespective of whether they are senders or receivers, is 2.78. In the case of a file-based approach, as currently is the accepted approach to design data communication, conceptually this measure would be one, except in the case of federated coordination models, in which case it would amount to the number of disciplines contributing to it (e.g., structures, mechanical, electrical, architectural, etc.). Nevertheless, even if this is a “rough” measure, it validates empirically the need to break down monolithic files into various sub-classifications based on the needs and requirements of the end-users’ task at hand: it shows that end users curate their own “federated model” on an as-needed basis if they are given a tool to do so.
5.7.2 Correlating Sources and Receivers
Overall, there are 11,495 total sources (each corresponding to one individual stream[32]), and 26,019 total receivers, embedded within five different host applications used in the design process. In this analysis, only data from experimental or proprietary clients developed by other parties (such as Excel and ETABS) has been culled as their correctness of implementation cannot be verified. Figure 41 breaks down by application the number of sources, or streams created from, and receivers, or number of streams received into that specific application. The last column, Ratio R/S, shows whether the respective application has been used more for sending data, or for receiving data, by calculating how many receivers there are for one given sender.
| Sources (S) | Receivers (R) | Ratio R/S | |
| Rhino | 866 | 725 | 0.84 |
| Grasshopper | 4,919 | 9,611 | 1.95 |
| Dynamo | 2,707 | 12,801 | 4.73 |
| GSA | 2,445 | 2,882 | 1.18 |
| Revit | 558 | n/a | n/a |
| Total | 11,495 | 26,019 | 2.26 |
Figure 41: Breakdown of sources & receivers by application type.
Individually, one can see that the two visual programming environments present, Grasshopper and Dynamo, have been used more for receiving (or recoupling data) than for sending data (with a R/S ratio of 1.95 and 4.73, respectively). In the case of Dynamo, the high R/S ratio confirms the observed workflows in the industry, whereby it is used to pull in data from other software, process it, and thereafter embed it into Revit. While Rhino comes across as primarily a source of information (with a R/S ratio of 0.84), GSA, a structural analysis software, has a balanced ratio (value 1.18), tipped towards receiving: this implies that data from multiple sources is used to assemble a structural analysis model.
Notably, the most important finding is the average R/S ratio across all applications, namely 2.26. Some sources potentially have no corresponding receiver, or, in other words, are not consumed by any party (albeit they can be used just for visualisation purposes online, in which case this is not tracked by the server); nevertheless, the table above includes this scenario. As such, the 2.26 receiver-to-sender ratio implies that there are, on average, for every given sender, two or more receivers. Lastly, by linking with the case made for data curation earlier on in this chapter (Section 5.2, From Sharing Files to Curating Data), this ratio entails that, within the limitations of Speckle, information is being shared and consumed in a productive manner by end-users and data is, on average, not being shared without intent and, implicitly, meaning.
5.7.3 Storage Performance
This analysis compares the performance from the point of view of storage space needed of a file-based approach and an object-based approach to design data classification. In the first table, presented below, a 3D Rhino model of the Villa Savoye is used as an experimental base (Figure 42). The model is split into the following categories, similar to examples seen in practice: (1) all, (2) structure, (3) walls, (4) auxiliary (furniture, windows, doors), (5) ground floor, (6) top floor, and (7) roof. Simultaneously, analogous SpeckleStreams using the same classification are created. These categories, while logically distinct, are not mutually exclusive (e.g., the ground floor classification (5) contains objects from (2) structure, (3) walls, and (4) auxiliary).
| Villa Savoye | Accumulated Size | % of total | Accumulated Speckle DB Size | % of total |
| (1) all | 39,067,396 | 100% | 36,017,005 | 100% |
| (2) structure | 43,027,966 | 110.14% | 36,037,020 | 100.06% |
| (3) walls | 53,075,937 | 135.86% | 36,062,421 | 100.13% |
| (4) auxiliary | 59,114,033 | 151.31% | 36,092,763 | 100.21% |
| (5) ground floor | 67,470,069 | 172.70% | 36,130,856 | 100.32% |
| (6) first floor | 77,698,734 | 198.88% | 36,179,276 | 100.45% |
| (7) roof | 82,339,127 | 210.76% | 36,231,523 | 100.60% |
Figure 42: Total storage space performance in a multiple sub-classification scenario on an example model.
The “Accumulated Size” column shows, in bytes, the total storage occupied by the individual sub-classifications of the model as they are progressively created. The “Accumulated Speckle DB Size” shows the total storage size of the database as the individual SpeckleStreams (containing the same objects as their equivalent file-based sub-classification) are being persisted. Simultaneously, the normalised value of the accumulated sizes is calculated as a percentage of the total corresponding to the two individual methods used in order to remove the bias introduced by the two different serialisation methods.
Initially, both the file-based approach and Speckle start with a similar value in terms of size (~39mb and 36mb, respectively). Nevertheless, as the model is sequentially split into multiple categories, one can observe a large deviation between the two methods: when all seven sub-classifications are in place, the file-based approach utilises ~82mb, whereas Speckle still only slightly more than ~36mb, essentially amounting to storage savings of almost 50% (~86mb vs ~36mb). This striking difference results from the fact that Speckle, when storing a new classification, first checks whether the objects that make it up already exist in the database (based on their hash, as discussed in Section 4.1 and 4.5), and if they do, does not store them again, only referencing the pre-existing object in the newly created SpeckleStream.
To corroborate the results from the previous table, the same methodology is applied on a Rhino file provided by an industry partner with a similar number of sub-classifications (Figure 43), specifically (1) the whole model, (2) structural elements, (3) façade, (4) raster (grid), and (5) interior (all project and office specific naming conventions have been removed in order to anonymise the source file).
| Anonymous Model | Accumulated Size | % of total | Accumulated Speckle DB Size | % of total |
| (1) all | 27,394,489 | 100% | 38,372,903 | 100% |
| (2) structure | 33,392,349 | 121.89% | 38,382,505 | 100.03% |
| (3) “fassade” | 50,523,295 | 184.43% | 38,392,510 | 100.05% |
| (4) raster | 51,396,360 | 187.62% | 38,396,094 | 100.06% |
| (5) interior | 57,204,093 | 208.82% | 38,411,053 | 100.10% |
Figure 43: Total storage space performance in a multiple sub-classification scenario on a model coming from a real life project.
This specific model has a different starting point: initially, the file size is smaller than its corresponding equivalent from the Speckle server’s database (~27mb and ~38mb, respectively). Nevertheless, as more sub-classifications are added, the same overall size savings trend in favour of the object-based approach can be observed as in the previous table (Figure 42).
Summing up, the cost of sub-dividing a model in a file-based approach is approximatively twice as high compared to an object-centred approach, as implemented in Speckle, in the scenario where the sub-divisions are not mutually exclusive. This last assumption is a limitation of this assessment: while, from a common sense point of view, it stands true, further work would be needed to understand the actual overlap between classifications, and, subsequently, storage performance of the two approaches assessed. Nevertheless, persisting a new classification on an existing base adds less than 0.1% to the overall storage size, showing that, with an object-based classification methodology, the actual cost of creating new logical groupings of objects is negligible.
5.8 Conclusion
This chapter investigated how the way digital design data is stored and classified influences the communication process. The three layers of the Speckle framework—the presentation layer (various application plugins), the application layer (encoding routines and the server) and the storage layer (MongoDB database and its data model), combine together to orchestrate a different technology for design data communication than that offered by contemporary file-based approaches. These two technologies must not be seen as excluding one another: on the contrary, they coexist and complement each other, as the approach outlined here relies on design models and the software applications that produce them; to a certain extent it is an added technological layer that aims to support natural communicative processes.
The differences between the two, when observed in action, lead to separate communicative processes that have been the subject of the analysis underpinning the non-technical sections of this chapter. The findings can be summarised as follows:
- The communicative productivity of an object-based curatorial approach to design data classification has been validated through both qualitative means, by assessing several case studies observed “in the wild” (Section 5.6.1), as well as through empirical observations based on the observed usage of Speckle:
- On average, design models were broken down into 2.47 separate sub-classifications, or SpeckleStreams (Figure 40). Furthermore, when taking into account sources coming into a given model, the average count of both sources and receivers per model was 2.78, highlighting a dynamic process of fragmentation and re-assembly (Section 5.7.1).
- Speckle client usage data across five different applications showed that, on average, for each single source there are at least two receivers (specifically, 2.26) (Figure 41). This further confirms that curated information is being produced and consumed in an efficient manner (Section 5.7.2).
- An object-based approach to data persistence is potentially twice as efficient as a file-based one in enabling multiple overlapping classifications of design information (Section 5.7.3). Furthermore, the actual cost of creating new classifications on an existing base is virtually negligible (< 0.1% of the original model size), which facilitates the emergence and evolution of efficient “informal” communication exchanges, as described in Section 5.6.2.
So far, the various transactional costs that Speckle implies have been discussed tangentially, such as the speed at which data is transmitted and stored, as well as the overall size of the information being exchanged. These matters are discussed in the following chapter, which assesses how to provide for, and optimise, the transactional requirements of the communication process in the context of digital design.
Footnotes
[23] These methodologies are described as “informal” only because of the self-definition of a different approach as being the “formal” one.
[24] During the course of this thesis, users can be either (1) developers that build on top and extend the functionality provided by the research instrumentation, or (2) end-users, such as designers, engineers or architects who interact with the system as a “finished product”. In this case, the text is referring to the latter.
[25] SQL stands for Structured Query Language. NoSQL does not imply “non-structured” query language – this is a common misconception; the acronym actually stands for Not Only SQL.
[26] Currently, the Speckle server implements several other authentication strategies that enable it to integrate with existing corporate environments (Auth0, Active Directory, Azure AD, Twitter, Github).
[27] The issue of continuity – or how one can identify that a modified object is the same, conceptually, as its predecessor – is tackled in Section 5.5, Data History.
[28] A diff is a data comparison between data objects through which one calculates and displays the differences and similarities between them.
[29] As mentioned previously, simultaneous editing of the same object collection is disallowed by convention; programmatically, there is no barrier preventing it from happening, and some users have put it to good use.
[30] Not to be confused with parametric modelling software, such as SolidWorks.
[31] All applications keep track of the objects in a given file using one form of an id or another. For example, Rhino uses randomly generated GUIDs.
[32] In total, there are 28,262 streams present in the database. The discrepancy between the number of streams and sources is explained by their (1) versioning and history, and (2) their direct programmatic creation (in which case sources and receivers do not get registered by the server).