Cite as: Stefanescu, D., 2020. Alternate Means of Digital Design Communication (PhD Thesis). UCL, London.
6.1 Nextness & Sequentiality
The previous two chapters challenged the status quo of data representation (how information is structured) and storage (what information is transmitted, and how it is classified) within the AEC industry. This research asserts that an object-centred design data sharing model can support organic communicative topologies to emerge, thus befitting natural dialogue. Nevertheless, simply storing and retrieving information is not enough as actors rely on extra-informational mechanisms to convey signals regarding the status of the communication itself, for example, whether the message has been successfully received or interpreted, whether that information was further used for other purposes, whether it caused confusion or clarity, etc. Consequently, this chapter looks at what is the best way to enable efficient and meaningful design data transactions from a technical point of view. Furthermore, this analysis is coupled with a qualitative assessment of end-user requirements in terms of interaction (and interfaces) needed to support their workflow and how these are reflected, limited or enhanced by the digital infrastructure available.
Social communication processes—human dialogue—have a set of requirements that enable their correct functioning. Beyond the most evident one, that there need to be two or more participants for communication to happen, there is nextness. As discussed earlier on in Chapter 2, nextness, or immediacy, is a key ingredient of a productive communication process. Essentially, it entails that messages between actors should not spread out in time between themselves as, by staggering them too far apart, their relevancy is compromised. A hypothetical example is person A asking B “What time does the train to Loughborough depart?”, and B providing the answer after the train has already left, or, generalising, after a delay that negates the relevancy of the information she or he provides to A.
For example, a long pause before an answer to a question can be interpreted by the sender as either reservation, confusion or doubt as to relevancy of the communication on behalf of the receiver. These mechanisms, while originally derived from the observation of face-to-face dialogue and interaction, have nevertheless analogues in digital communication systems, from chat applications to code collaboration platforms. For example, WhatsApp, Facebook Messenger, and many other similar offerings convey to their users, through various interface mechanisms, whether a certain message has been successfully sent, whether it has arrived at the recipient, and whether it has been actually read. The capacity of such systems to convey meta-information enables a much richer, satisfying and efficient digital dialogue to happen. For example, if person A sends an urgent inquiry to person B, and, after one hour of waiting, A can see that B still didn’t read the message, A can now decide to make a phone call in order to resolve the situation. Github, a collaborative platform for writing software, has similar mechanisms for notifying users of various informational transactions, such as code modifications, issues, reviews, comments, pull requests, etc.
Institutional or professional communication, of course, does not necessarily have the same strict temporal requirements as informal, person-to-person dialogue. Within such a context, actors work in parallel over spans of time that can be long or short depending on the requirements of their common activity, and synchronise (or coordinate) efforts using a different rhythm than direct interpersonal exchanges. However, in this scenario, a concept parallel to nextness takes precedence: sequentiality. As mentioned previously in Chapter 2, Garfinkel, posits that an act of communication is an ordered sequence of information exchanges (Garfinkel and Rawls, 2006) that, in time, create a shared context for the communicants. This allows them to situate codified information and consequently, as Sperber and Wilson note, optimise the relevancy of their exchanges (Wilson and Sperber, 2008) as well as constructing a sense of shared understanding (Mondada, 2011).
The examples above are meant to briefly underline the capacity of the digital medium to shape and enforce communicative contracts by making the sequentiality of information exchanges between actors visible and, to a certain extent, tangible. Referring back to the first example wherein A asks B at what time the train to Loughborough departs, and B, ignoring A for a period of time, replies after the train has already left, thus rendering the exchange useless, one can state that B, by deferring his answer, violated the communicative contract commonly expected of natural, interpersonal dialogue by deliberately breaking its sequence. In face-to-face interactions, these transgressions (or compliances) are self-evident or implicitly facilitated by the reality in which the conversation is happening and the social norms by which the participants abide. Nevertheless, in the case of institutional dialogue (i.e., two or more organisations collaborating), communication contracts need to be explicitly defined as protocols. In the case of the digitally enabled information exchanges, these protocols need to be technologically fulfilled by providing instruments for making the order and relationship between information exchanges tangible.
Current collaboration workflows, as specified by BIM methodologies, do not lend themselves easily to design data informed dialogue. The problem is two-fold, but both its aspects share a common root. First, the speed of digital data transactions is limited by the size of the discipline models, or files, that are used, fact which is acerbated when taking into account potential limited internet connectivity speeds. Consequently, these design files and models, because of their size, impose limitations on the immediacy of the transactions involved thus leading to a well demarcated, formal process that does not lend itself easily to the parallelisation of work. Coordination, seemingly, happens once a week by popular consensus (van Berlo et al., 2012). Second, file-based transactions (or model based) encode a high number of changes in bulk in a non-transparent manner. As follows, it is difficult to extract the sequences, or causal relationships, between the exchanged information as it is not explicitly available. For example, an architectural design model, over a week, accumulates a number of changes in the layout of the building. Some of these are the direct consequence of changes and insights gathered from the structural model. Simultaneously, during the same week, the structural model undergoes various other changes coming from the MEP model. As follows, these changes, because they are not immediately available to all interested participants, have the potential to negate each other: the architect worked on stale data, thus creating a layout that does not respect the structural model due to its simultaneous modification resulting from the installation of a new water column in the MEP model. Furthermore, because there is no clear relationship diagram available between the models themselves, the participants cannot judge the impact of their changes and cannot determine whether certain parts of the overall design need to be updated to reflect the latest information.
To better understand the dynamics of multi-disciplinary teams and validate the claims above, as part of the living laboratory context within which this research project was undertaken, a workshop on practice-based workflows was facilitated. Therein, several key engineers and project managers from Buro Happold (engineering consultancy) and Rhomberg Sersea Group (construction developers) were invited to describe the usual process that a project would go through in terms of data exchange pertaining to certain design tasks that they were familiar with. The participants were guided through a set of storytelling exercises in which they would describe specific projects they were involved with, but as well “roleplay” other actors from within the teams with which they were involved.
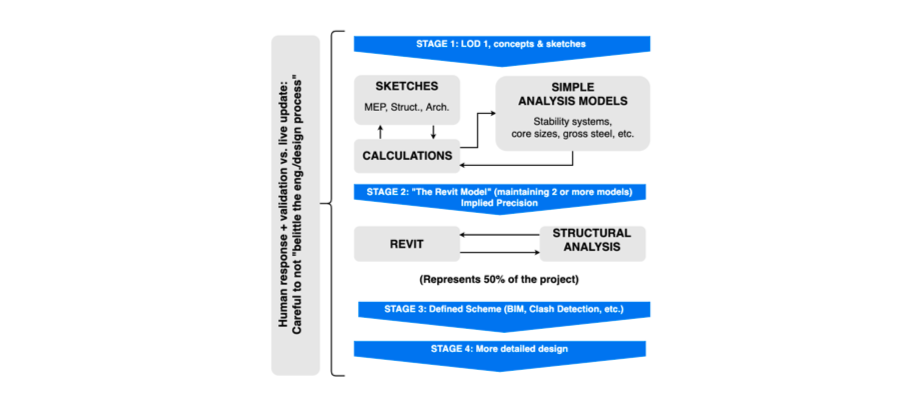
Figure 44: Sample storyboard showing conception stages in the engineering process, from early stage design (sketches, hand calculations and simple analysis models) through the middle stages, where the BIM model is actually composed, and finally to final, detailed design stages (from Poinet, P. AEC Deltas, UCL).
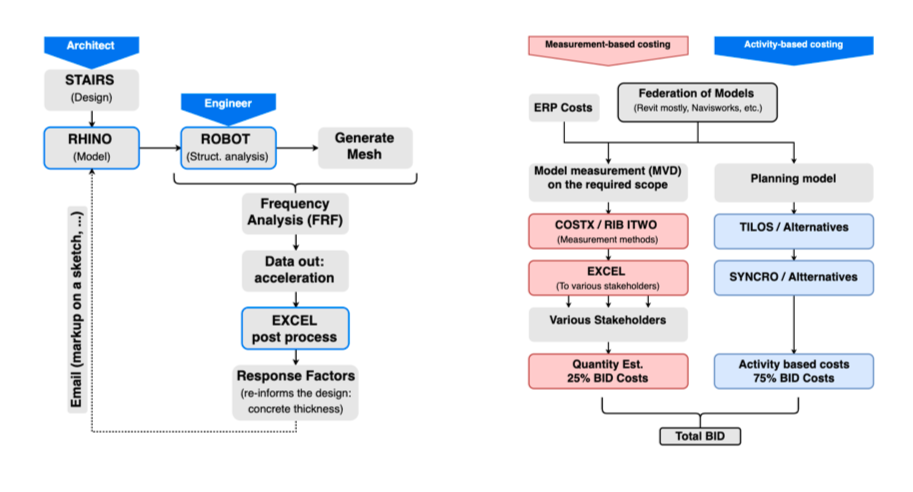
Figure 45: Left: Architect-Engineer workflow during the design and analysis of a complex interior staircase project. Right: Workflow for a bid costing process undertaken by a developer and its subsidiaries. In red, is the measurement based process (quantities), and in blue the activity based process (site planning & construction management) (from Poinet, P. AEC Deltas, UCL).
The workshop yielded, in total, ten user stories involving roles such as planner, quantity surveyor, design coordinator, engineer, as well as field operatives. These user stories, or workflow maps, spanned from finite, contained design tasks such as the structural optimisation and specification of a complex stairway to project costing and bid creation, as well as on-site project delivery assessment. For example, a planner wants to associate planning activities to design objects to be able to plan activities in planning software (e.g., Tilos, Primavera P6, Bentley Synchro, Microsoft Project, etc.); an estimator needs to create a model view on the design scope in order to bring it into an estimation software and create a cost estimate; a design coordinator collects and federates the latest BIM models to assign design tasks/issues back to the individual consultants (Figure 45); a structural engineer needs to have different view of the same data so in order to concentrate only what is important at any given time (Figure 44).
Each discipline, and even each actor, navigates within their own ecosystem of tools that act as an extension to their knowledge and skills. The participants highlighted the fact that manual interventions are required throughout the process. Two time-consuming issues were highlighted. The first is data conversions between the various proprietary formats and subsequent cleaning and pruning of information. This can partly be attributed to the segregated and siloed nature of the different software packages that they are using to achieve their tasks. This results in slow design iteration cycles due to the large amount of information being transferred, its lack of usual suitability for the task at hand as well as its incompatible formats and potential errors. The second issue raised was extensive coordination with other team members to ensure data consistency across all the actors: does the seismic analysis model incorporate the latest changes from the architect’s model? did the architect incorporate the changes from the lateral loads analysis? does the costing use the latest specified construction method? was the project schedule updated with information from the latest coordination model? etc. Common in many areas, this process is seen as “data wrangling”, or “data massage”. Ultimately, it causes slow update cycles—resulting from the friction of data conversion and processing—that, in turn, lead to a weakening of nextness: instead of being close together, communicative exchanges are far spread apart and, as such, lose their relevance in the minds of the participants.
Another cause is the lack of a tangible sense of sequentiality in a digital communicative environment. In a normal, face-to-face situation, participants to a conversation would be able to follow along the issues being discussed by virtue of the order in which the they speak: each speaker’s utterances follow, and depend on (or react to) the previous ones. In a digital conversation, that may span multiple geographic areas and their associated time zones, one cannot rely on the same heuristic, or embedded mechanisms to understand the sequence of informational exchanges as present in the real world. Firstly, this is because participants are not in the same physical space. Secondly, because, unlike a human conversation, digital conversations happen quasi-simultaneously and overlap in various layers: while participating in a larger data exchange environment pertaining to a wider aspect of the design problem, one can have in parallel smaller, more directed conversations pertaining to various sub-issues with different stakeholders. Finally, sequentiality is befuddled because the file-based approaches currently employed cause the information to be detached from its source: once an export is made, it has no links back to the model that originated it; it becomes “disembodied”.
As follows from the analysis above, two technical research directions become evident. The first tackles the issue behind the lack of nextness in digital design communication, and specifically looks at whether one can decrease the spacing between data exchanges by minimising their size by decoupling them from the magnitude of the model (or file) itself. Second, this chapter investigates how the sequentiality of digital information exchanges between actors can be expressed and revealed to the participants in order to reduce the intensive coordination requirements resulting from detaching the transmitted information from its source.
6.2 Optimising Transactions: Differential Updates
6.2.1 Differential Updates
The previous chapter described the three main sections of the system architecture of the research instrumentation, namely the presentation, application and persistence layers and provided a general overview of the way they interact. Now, this section addresses the way design data transactions between these layers is implemented. While there are many points of interaction that facilitate various informational exchanges between the systems, the most important (by volume) aspects relate to the transfer of design information (geometry—points, lines, etc.—and associated metadata) between a client application that generates the data, the database and another client application that consumes the data.
Document- or model-based approaches to communication propagate changes in bulk. That is to say, if one object of the model is modified, then the whole model is re-sent to the persistence layer in order to propagate one single change. Consequently, this leads to sub-optimal transactions: even if the actual modification is small, the amount of data being transferred directly depends on the size of the model. This results in waiting times that are longer than necessary, even in the context of a collaboration system deployed on a local network (for example, inside a company’s offices). In the case of a distributed system, i.e., where the system relies on digital networks infrastructure, this problem is even more present due to increased latencies and middle-ware handling of the routing and distribution of information packets across a geographically dispersed network. Moreover, longer transaction times limit a communicative act by impeding its immediacy due to the fact that, in the end, the speed of the transactions is directly proportional to the size of the model, and not of the change effected.
Speckle, being object-centred, allows us to implement a differential compression layer within the transaction logic of the API clients (at both the sending and receiving end). In essence, this allows us to identify and transmit only the changes between the various states of the object collection (SpeckleStream), thus reducing the transmitted information to the minimum required. This is possible by leveraging a local cache of objects that have been already sent or received. Initially, this cache was implemented “in-memory”, in other words it does not persist after the client application that authored or received the objects has been closed. In later, more mature implementations, this cache resides locally on the user’s hard disk in a SQLite database that enables checking against both outgoing data (objects being sent) as well as incoming data (objects being received), across multiple authoring applications, and across an unbounded amount of time, not restricted to computer or host application restarts.
For example, when creating a new SpeckleStream x consisting of entirely new objects (A, B and C), the original state of x is “empty” (x = ⊘). Consequently, all objects will be sent to the SpeckleServer in order for them to be saved in the database, and thereafter x = {A, B, C}. Through a subsequent modelling operation, objects B and C are modified and, because of the immutable approach to object identity based on unique hashes of their properties described in the previous chapter, they become B* and C*; A nevertheless stays unchanged. Next, by performing a set intersection between the previous state of x ({A, B, C}) and its new local state ({A, B*, C*}) one can assemble the actual content of the update transaction as being U = {ref A, B*, C*}. ref A is understood as a purely symbolic reference to the original object, and not its actual content; this approach is needed in order to maintain the correct order of the objects inside the collection and is a simpler and leaner implementation (for some cases) as opposed to providing extra information with the update payload as to what objects to remove or insert and from which index. At the end of the process, the SpeckleStream x = {A, B*, C*}. In the meantime, each successful update transaction has also been recorded in the local cache. After the stream creation, the cache contained only {A, B, C}, whereas by the end of the second update, it increased to {A, B, C, B*, C*}.
The cache can be seen as a ledger in which one can keep track of which objects already exist in the persistence layer. Consequently, it can be leveraged across multiple update operations coming from different locations in order to optimise the transaction size. For example, if one were to create a new SpeckleStream, y, containing objects B*, B and C, because the system knows that these objects already exist in the persistence layer, the update payload will only contain a list of symbolic references to B*, B and C, without the actual object content, thus greatly speeding up the transaction speed. Furthermore, an equivalent data differencing approach can be applied when receiving information, or updating a SpeckleStream. For example, a client receives information from SpeckleStream x. Initially, this contains three objects, namely {A, B, C} which are stored upon retrieval in the local cache. Subsequent updates from the authoring application add several objects to x, so that its status is now {A, B, C, D, E, F}. When updating x, the client will cross-check with the local cache to see if an object already exists before requesting it from the server and potentially incurring a high transactional cost. In the current scenario, because the cache already contains {A, B, C} the only objects that are actually transferred between the persistence layer and the receiving client are {D, E, F}. Similarly to the updating process, this results in a large reduction of the overall size of information being transferred, thus increasing the speed with which an application that consumes data can enact an update.
Simply put, this approach can be described as a client-side differential compression algorithm operating at the level of design data object sets (SpeckleStreams). It leverages the approach to object identity and immutability described in the previous chapter to incrementally create a shared informational context which is thereafter used to reduce information redundancy and consequently the amount of information being transferred. Similarly to natural dialogue, where participants rely on their shared context in order to increase the relevancy of their exchanges, this approach leverages a technically created context for speeding up design data transactions.
6.2.2 Observed Performance
So as to be able to quantify the impact on data transactions that differential updates have, this section presents an analysis of the transactions associated with the streams from a live project in which Speckle was used to coordinate the design process between several disciplinary groups. The full process and the relationship between the stakeholders involved is described in more detail, as well as qualitatively assessed, in Section 6.5.3, Design and Façade Engineering.
The first table compares the total and average size of the first part of a transaction, namely the one in which the receiver sends the data, in two distinct scenarios (Figure 46). The first, namely the “Delta” scenario, describes the actual way Speckle works, and leverages the differential update mechanism described in the previous section. The second, the “Bulk” scenario, discounts this and assumes a file-based approach in which the current state of data is always shared in full.
The transaction size in both scenarios was calculated based on the average object size as reported by the database, namely 4.5 kb (see Section 4.3). It is important to note that this eliminates the bias introduced by employing different serialisation methods (i.e., pertaining to the data format used). The time column shows, hypothetically, how much an average upload would take based on UK national averages on internet speed (specifically, an upload speed of 7 Mbps, or 875kb/s)[33]. Lastly, the final column shows the rapport between the average time of a Bulk scenario transaction versus a Delta scenario one. Overall, across the eight streams that were analysed, the total number of recorded transactions is 122, spread across a period of approximatively two weeks [34].
| Total Delta (kb) | Avg. Delta (kb) | Avg. Time Delta (s) | Total Bulk (kb) | Avg. Bulk (kb) | Avg. Time Bulk (s) | Bulk/Delta | |
| stream A | 8,586.90 | 505.11 | 0.58 | 18,701.30 | 1,100.08 | 1.26 | 217.79% |
| stream B | 902.4 | 150.4 | 0.17 | 2,284.20 | 380.7 | 0.44 | 253.13% |
| stream C | 2,472.20 | 274.69 | 0.31 | 3,064.40 | 340.49 | 0.39 | 123.95% |
| stream D | 67,087.80 | 13,417.56 | 15.33 | 193,809.20 | 38,761.84 | 44.3 | 288.89% |
| stream E | 876,625.20 | 16,233.80 | 18.55 | 1,130,411.10 | 20,933.54 | 23.92 | 128.95% |
| stream F | 45,369.10 | 5,671.14 | 6.48 | 108,993.00 | 13,624.13 | 15.57 | 240.24% |
| stream G | 37,722.20 | 6,287.03 | 7.19 | 69,146.40 | 11,524.40 | 13.17 | 183.30% |
| stream H | 36,711.70 | 4,079.08 | 4.66 | 75,435.00 | 8,381.67 | 9.58 | 205.48% |
| average | 134,434.69 | 5,318.84 | 6.08 | 216,063.70 | 11,880.09 | 13.58 | 205.22% |
Figure 46: Comparison table between transactions in a differential update approach (Delta) and a bulk sharing approach.
The table shows that the overall Bulk approach ranges between being 123% (stream C) and 288% (stream D) larger than the Delta approach, averaging at 205%. Streams C and E exhibit a lower Bulk to Delta ratio, signifying that the changes that these sub-classifications underwent were major. However, without employing differential updates, the average cost of the first half of a transaction, namely sending, is twice as high as with. This cost is incurred solely by the sender.
The second part of a transaction, namely receiving, has a different cost and is incurred multiple times by each stakeholder that receives the data being transmitted. As shown in Section 5.7.2, Correlating Sources and Receivers, on average there are 2.26 receiving parties for each sender. Nevertheless, proportion wise, this does not affect the observed efficiency of the differential update method as compared to the bulk one; it only influences the absolute amount (size) of data being transferred.
In order to highlight the dynamic nature of data transactions, the chart below presents a view on the 15 recorded transactions from Stream A in chronological order (Figure 47). Each transaction is broken down by number of objects added (green), removed (red), and common (grey).
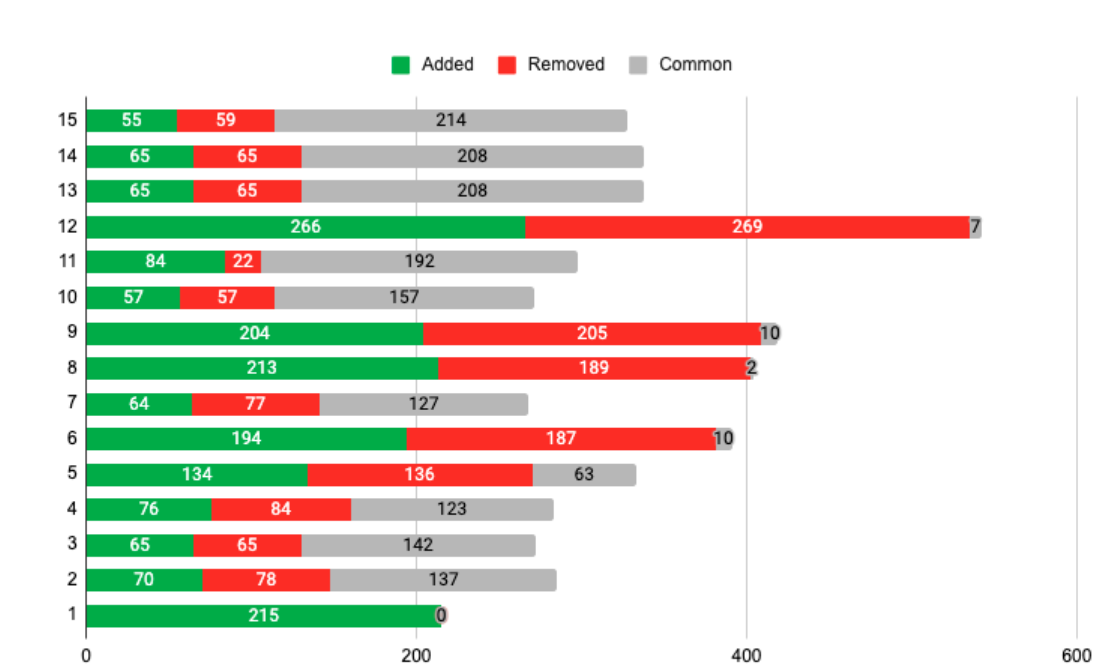
Figure 47: Transaction breakdown: green represents newly added objects, red removed, and grey unchanged.
The chart above shows a high range of dynamism, from small changes (transaction 11) to complete “re-writes” in which all, or almost all, the objects are removed and replaced with newer ones (e.g., transaction 6 and 12). In order to quantify the impact of this process, the table below shows an expanded view of each transaction (Figure 48). Specifically, the second, third and fourth columns (Added, Removed, and Common) detail the nature of the transaction broken down by the number of objects involved in the respective operation. The Delta Size column shows the estimated amount of data transferred based on an average object size of 4.7kb[35] and the amount of “Added” objects, which are all assumed as being unique[36]. The Bulk Size column is calculated based on the total number of objects per stream. Lastly, the Bulk/Delta column shows the ratio between the previous two.
| Transaction | Added | Removed | Common | Total | Delta Size (kb) | Bulk Size (kb) | Bulk/Delta |
| 1 | 215 | 0 | 0 | 215 | 1010.5 | 1010.5 | 100.00% |
| 2 | 70 | 78 | 137 | 207 | 329 | 972.9 | 295.71% |
| 3 | 65 | 65 | 142 | 207 | 305.5 | 972.9 | 318.46% |
| 4 | 76 | 84 | 123 | 199 | 357.2 | 935.3 | 261.84% |
| 5 | 134 | 136 | 63 | 197 | 629.8 | 925.9 | 147.01% |
| 6 | 194 | 187 | 10 | 204 | 911.8 | 958.8 | 105.15% |
| 7 | 64 | 77 | 127 | 191 | 300.8 | 897.7 | 298.44% |
| 8 | 213 | 189 | 2 | 215 | 1001.1 | 1010.5 | 100.94% |
| 9 | 204 | 205 | 10 | 214 | 958.8 | 1005.8 | 104.90% |
| 10 | 57 | 57 | 157 | 214 | 267.9 | 1005.8 | 375.44% |
| 11 | 84 | 22 | 192 | 276 | 394.8 | 1297.2 | 328.57% |
| 12 | 266 | 269 | 7 | 273 | 1250.2 | 1283.1 | 102.63% |
| 13 | 65 | 65 | 208 | 273 | 305.5 | 1283.1 | 420.00% |
| 14 | 65 | 65 | 208 | 273 | 305.5 | 1283.1 | 420.00% |
| 15 | 55 | 59 | 214 | 269 | 258.5 | 1264.3 | 489.09% |
Figure 48: Historical analysis of a stream's transaction record.
In the first transaction, 215 objects are added. Consequently, the two approaches yield a similar ratio. In this specific scenario, there is no advantage between the two approaches. Nevertheless, in the second transaction, 78 objects are replaced with a different 70, whilst 137 are the same. This leads to a much greater efficiency when employing differential updates: the bulk approach is almost three times bigger than its counterpart, as implemented in Speckle. Similarly to the former scenario, the 12th transaction holds only 7 common objects, with the bulk being replaced (205 removed, and 204 added). In this instance, the gain difference is minimal (the bulk approach is only 2% larger than the differential update one). Overall, the differential update method provides size (and, implicitly, duration) significant savings over the classic approach, which may be 489% the size of an equivalent delta (Figure 48, Transaction 15). In other words, it can be five times faster and five times smaller.
6.2.3 Theoretical Best & Worst Cases
On average, differential updates allow for data transactions to be half the size as they would be if a classic, file-based methodology, was employed; it was observed empirically to be five times faster and leaner in size. To fully assess the performance of this method in its best- and worst-case scenario, the chart below shows the transaction history of stream E which includes exhaustively both (Figure 49). It is accompanied by a following table (Figure 50), showing two exemplary transactions, one “worst-case”, and one “best-case”, derived in the same way as the previous one from Section 6.2.1, and containing the same headings.
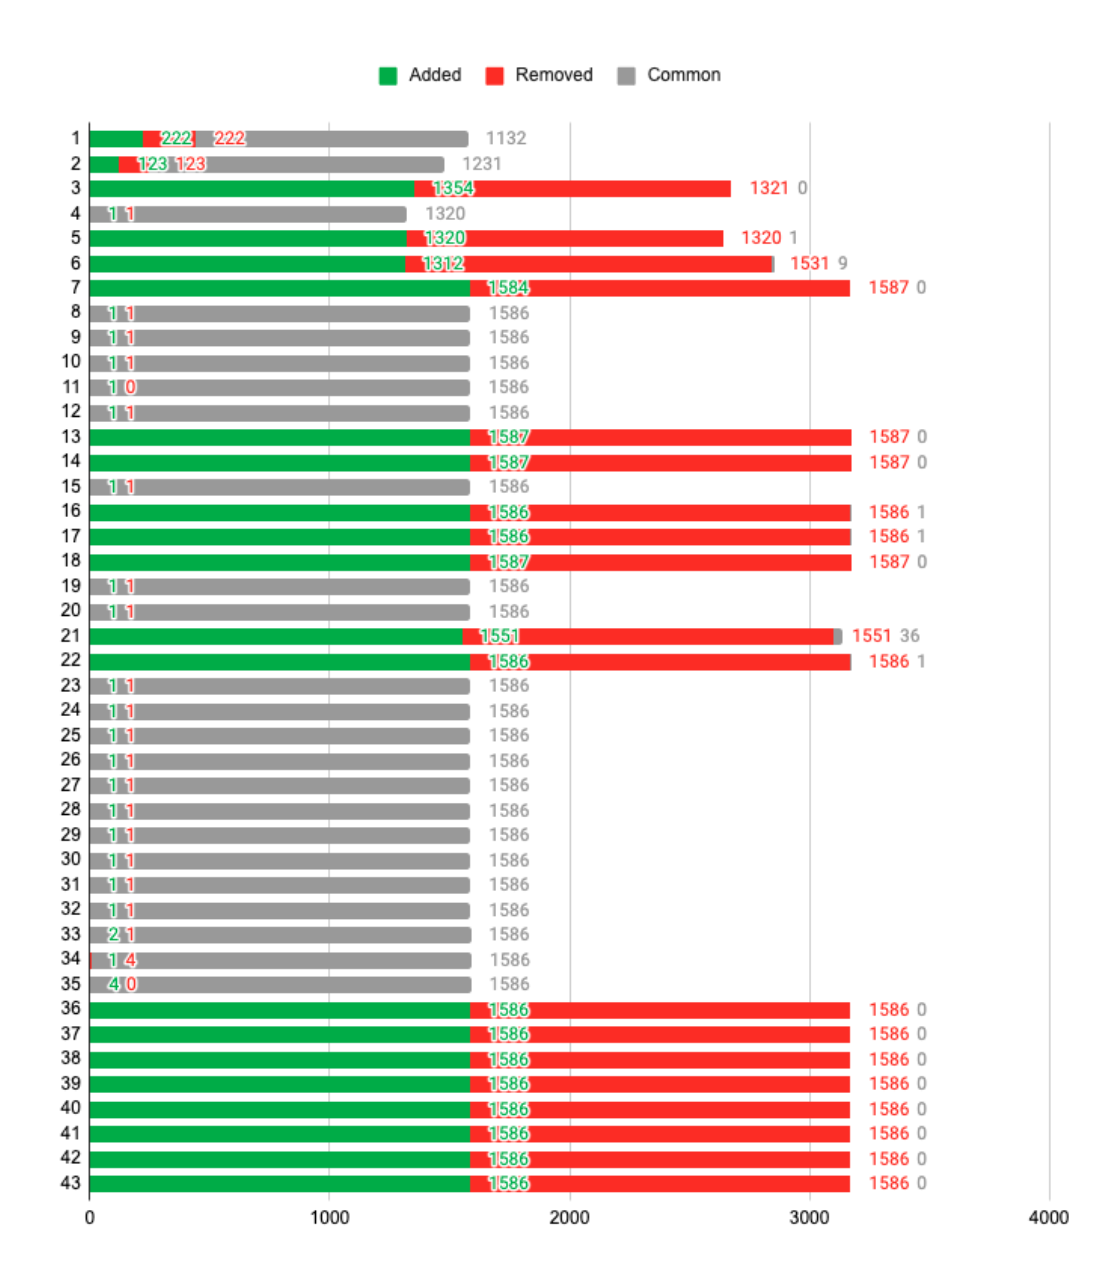
Figure 49: Transaction history for Stream E. Green represents newly added objects, red removed, and grey unchanged.
| Transaction | Added | Removed | Common | Total | Delta Size (kb) | Bulk Size (kb) | Bulk/Delta |
| 36 | 1586 | 1586 | 0 | 1586 | 7454.2 | 7454.2 | 100% |
| 32 | 1 | 1 | 1586 | 1587 | 4.7 | 7458.9 | 158700% |
Figure 50: Expanded table showing transactions 32 and 36.
Stream E’s transaction history is comprised in approximatively equal parts of minor changes and complete “re-writes”. Speculatively put, the end-user seems to be searching for a suitable design, completely changing the information being sent (the transactions with zero common objects) and as well thereafter surgically fine-tuning it (the transactions with only one added and removed object). For example, transaction number 32 is one of surgical fine-tuning, whereas transaction 36 is a complete overhaul of the data contained in the stream.
The expanded table detailing these two transactions shows the extremes in comparative performance between the approach utilising differential updates and the bulk, file-based one. In the worst-case scenario, the two are equivalent, with a Bulk/Delta size ratio of 1 (100%). Nevertheless, transaction 36 shows a staggering improvement: because of the fact that the change size is small in comparison with the unchanged objects, the file-based approach is 158.700 larger than the differential update one. Mathematically speaking, the best-case scenario has no theoretical upper limit: if the change size is small enough compared to the whole, the transaction cost will be tending towards infinity.
Lastly, the file-based approach to data transactions can be seen as only having a “worst-case” by virtue of the fact that it always includes all the information, regardless of whether it was modified or not. In a social conversation, this would be akin to repeating all previous statements before adding one’s own. Nevertheless, the differential update method, as observed in its implementation in the Speckle plugins, decouples the transaction size from the model size, and allows for change-dependent digital design data transactions.
6.3 Assembling the Network
In order to provide a comprehensive overview of the communicative network and its topology as it emerges during the design process, an overview on where the information is coming from and where it is going towards is needed— in short, who are the senders and receivers. So far the term client has been used to denote the actors that interact with the SpeckleServer through the publicly exposed API, nevertheless there is no persistent trace of them. This means that if John updates stream X from a design application using a specific client, one has no way of notifying Mary and Howard who consume design data from stream X that their information is now stale. Consequently, the technical instrumentation, Speckle, needs to incorporate a way of keeping track of (1) individual users and (2) the clients that they create in order to transact (send and receive) design data. Furthermore, it needs to enable a way in which information about the status of transactions can be pushed to the interested parties, for example “SpeckleStream X has been updated”, which will be discussed in the Propagating Information section.
6.3.1 Users
In order to identify which human actors create what design data, a basic user authentication system on the application layer is implemented, specifically within the SpeckleServer (as part of the API). In order to access and use the Speckle API, a person must register with the system. The details that need to be provided are kept to a minimum—namely email and password. There are other optional fields, such as full name and company[37]. After registering with a specific instance of a running SpeckleServer, an end-user now has access to the full power of the API.
The implementation of authentication depends on an architectural choice between opting whether the SpeckleServer should be stateful or stateless. A stateful system implies sharing between client requests the user’s session details, whereas a stateless server must be able to perform authentication (or other operations) on a by-request basis. The former is easier to implement, nevertheless the system architecture is much more difficult to subsequently scale, which has an impact on performance in cases of high usage. Consequently, a stateless architecture is used, which essentially allows for an infinite number of SpeckleServers to be simultaneously run (nevertheless sharing one persistence layer) in order to meet the user demand that they encounter.
Consequently, this means that a user has to provide a proof that she or he is authenticated on every API call. A standard industry pattern is implemented by generating expiring JSON Web Tokens (JWT) upon a user login and the moment of initial registration, which then the user must provide with every request as proof of his identity. The JWT encodes within it the user’s information as well as an expiry date. Subsequently, the SpeckleServer thereafter uses this information to assign ownership information to any resource (SpeckleStream, SpeckleObject, etc.) that is created, as well as to authenticate any other incoming requests. As follows, this allows us to keep track of who is creating design information, as well as who is accessing it at the API level.
Moreover, this identification mechanism allows us to implement a permission system at the resource level. In short, this enables users to control the accessibility and visibility of the design data they are producing. For example, when streams are created, they currently default to a “public” status, which enables anyone to read them, but only their owner to write or edit them. This is similar to the “link sharing” functionality popularised by web applications such as Google Docs. Finer grained permissions can be set, enabling various levels of control, so as that some users can have read and write permissions, or only reading and commenting, or potentially fully private and accessible only to their owner. Technically, this is achieved by expanding the schema definitions of each object to include a field for storing the user’s id that created the resource (owner), an array of users that have read permissions (canRead) and write permissions (canWrite).
In short, the SpeckleServer implements a Discretionary Access Control (DAC) system. This is formally defined as a means of restricting access to objects based on the identity of subjects and/or groups to which they belong. The discretionary aspect relates to the fact that a user, with the right set of permissions (namely write) on a given resource, can pass on that right to any other user she or he needs to. This particular pattern was chosen over the more common group- (or role-) based access control systems as it further enforces the end user to consciously share a given resource with others, and thus, give thought to the question of whom he is engaging with specifically—as opposed to simply sharing information with an abstract group of persons defined by an access level.
6.3.2 Application Clients
The authentication mechanism described above accommodates only partially the embodiment of sequentiality in a digitally enabled communicative process. This is because, in a digital design process, information is authored in more than just a verbal (or textual) way: each stakeholder, or each discipline, uses various software tools to solve parts of the assignment. For example, based on the instrumentation described so far, the research instrumentation can track that Mary, the lead architect on the project, has updated the architectural drawing plans and the massing model. Similarly, Howard, the façade engineer, has previously retrieved the information pertaining to the massing model. Nevertheless, in order to be able to trace the casual relationships between these communicative acts, and thus communicate to the actors participating in this dialogue the sequence of their informational exchanges, this information needs to be coupled with its origin as well as with where it is consumed.
As such, a new concept is introduced, that of Clients (full name UserAppClient) that track where and what information is produced or consumed and by whom. In order to do so, an instance of a Client object contains a reference to a SpeckleStream (thus answering the question of what information is being communicated), a reference to the User that created the client (answering who is communicating), the role of the client (sender or receiver), and several fields that identify where the information is being produced or consumed. These are (1) documentGuid, (2) documentName, (3) documentType and (4) documentLocation. These fields are self-explanatory—they help to identify the original file or model (through its name, unique identifier if present and its location on the user’s file-system) and host application (such as Rhino, Revit, etc.).
Consequently, through the implementation of application-specific clients, one can guarantee, to a certain extent, that when information is being produced and consumed, it is intrinsically tied to the specific location of these events. Furthermore, by cross-referencing clients against their documentType, documentGuid and documentName, one can identify casual relationships at a global level between initially disparate information exchanges. For example, Stream A and Stream B are being consumed by two individual Clients that, nevertheless, are identified as being in the same Model X as where Stream C originates from. While the exact nature of the relationship cannot be programmatically deduced as it is up to the end-user, this does strongly suggest that Stream C is dependent on Streams A and B. Furthermore, this mechanism is well suited to identify the feedback loops within the digital design process, as the process graph that can be assembled is not necessarily directed. Expanding on the example above, let us assume another model, Model Y, where Stream C is consumed. Model Y is also the source of Stream D, which—for the sake of brevity—is being received in the original Model X. In this scenario, what one can infer is a recursive dependency between Model X and Model Y: information being produced in X is consumed in Y, and vice-versa. A less abstract scenario can be formulated as a design-data informed conversation between a structural engineer and an architect, who iterate on a given problem’s solution based on each other’s inputs (and, by extension, expertise, viewpoints and values).
Summing up, Clients help us ground the informational exchanges between the actors involved in the design process with a higher degree of fidelity, and are the principal means through which one can reconstruct the sequentiality of a digitally informed design dialogue. It is important to note that the resulting process diagrams, or the communicative network that is thus documented, is not one-directional (such as a DAG) and can contain feedback loops. Furthermore, one can envision both a passive role, by which one may document the actors’ communication network and identify bottlenecks or potential tasks that can be concurrently executed, but as well as an active role in which the network is articulated in a top-down fashion and thereafter acted out by the respective stakeholders involved in the design process.
6.4 Information Propagation
The previous chapter described the way design information is stored and retrieved and the various interactions between the persistence layer of the system and the subsequent application-specific implementations through the REST API layer exposed by the SpeckleServer. Nevertheless, these operations are silent: if someone updates a specific object, or set of objects, this act itself is not communicated; in order to verify that one has the latest information, one has to explicitly query the server for an update. Nevertheless, this does not satisfy the requirements for a communicative contract. Consequently, Speckle will leverage the virtual process diagram that can now be assembled based on the new concepts introduced above (Users and Clients) to communicate, or propagate information pertaining to the status of the data they are transacting.
In order to do so, a secondary real-time communication layer is implemented within the SpeckleServer that allows for near-instantaneous volatile message passing between one or more clients. At its core, it is based on the WebSocket (WS) protocol, which was explicitly designed for this purpose. Consequently, the SpeckleServer now exposes two different types of servers: HTTP, that enables the REST API described in the previous chapter, and a WS server, that allows clients to communicate between themselves in real-time.
Because of the stateless nature of the SpeckleServer, there is a distinct need to coordinate these messages across potentially an infinite number of instances running in parallel. This is achieved by introducing a new in-memory fast data store, namely Redis, that acts as a message buffer between the individual server instances. For example, if an instance of the SpeckleServer receives a message, it will propagate it, via Redis, to all other SpeckleServer instances.
This supplementary communication channel is used for the transmission of meta information regarding the actions undertook by a client, e.g., “the following objects were created” or “client X received the updated information”. This is achieved through a set of predefined (at the client level) real time messaging types that deal with data creation and updating. Moreover, Speckle allows for the expansion of this protocol on a client by client basis in order to serve different needs such as automation and analysis.
The WS communication protocol implemented by the SpeckleServer is structured around specific channels, or “rooms”, that correspond to individual streams. The WS API itself contains the following operations, which clients can use:
- Join: A client expresses his interest to join a specific messaging room, usually pertaining to a specific SpeckleStream.
- Leave: The opposite operation to the above, namely leaving a SpeckleStream’s announcement room.
- Broadcast: A client broadcasts a message in a specific SpeckleStream’s room to all clients that are currently present in it.
- Message: Sends a direct message to a specific client by its _id. This does not require the client to be actively present in any SpeckleStream’s message room.
- Ping: Message sent by the server to all connected clients at a specific time interval to check whether they are still connected. If no response is given, after a certain set of missed “pings”, the client is removed from the server.
The actual decoding, interpretation and subsequent acting on of the information contained in the WS messages is done at a client level and is not enforced at a central level in any way. This entails an approach based on convention, rather than standardisation. As part of the existing software integrations, SpeckleRhino, SpeckleGrasshopper, SpeckleDynamo, and SpeckleThreeViewer, all the clients implement only two message types. These are:
- global-update: This message is broadcast in the event of an application client updating a SpeckleStream’s object list, name and any other data.
- metadata-update: This message is broadcast when an application client updates a SpeckleStream’s name and/or layer list.

Figure 51: Message diagram showing the hypothetical flow of information between three clients (A, B, and C), as mediated by the Speckle Server.
As follows, these two message types allow for the propagation of information across the loosely coupled network of assembled clients by enabling authoring clients to notify the clients that consume information that data has changed. Conversely, rather than having to explicitly check if design data is stale, consuming clients know when their source of information has been modified and, depending on their implementation details, act accordingly. For example, the SpeckleGrasshopper integration defaults to pushing out data updates continuously on any change (with a maximum of one update per second). Receivers, when notified, will also immediately “refresh” and pull in the new information. Nevertheless, the online viewer, SpeckleThreeViewer, upon receiving a message that data is now stale, will display a notification to the user and not update instantly, thus passing the responsibility of coordination to the end user. Figure 51 exemplifies such an exchange between three different clients, A, B, and C as mediated by a SpeckleServer. Client A is the sender; Clients B and C can be associated with the SpeckleThreeViewer and SpeckleGrasshopper, respectively.
6.5 Case Studies
The following case studies, collected both from during the secondments with the project’s industry partners, as well as from private initiatives that customised Speckle to meet their own needs, demonstrate an enriched digital design communication process. The first leverages the transactional potential of Speckle to integrate technical (computational) actors in a digital design process. This is followed by two other examples that focus on the human aspects of a multi-disciplinary design team and their communicative process.
6.5.1 Solution Space Precomputation and Mass Customisation
By providing a digital basis on which nextness can be reconstructed in a virtual environment, one can define communicative contracts that, through more explicit messages, encode new behavioural actions for non-human (technical) actors. Speckle has been applied in this manner for enabling solution space exploration interfaces. Specifically, it was used to parallelise the pre-calculation of multi-dimensional solution spaces.
Design space exploration has been a recurring topic in computational design, visible in the late 1970s work by Robert Aish and Tom Maver with PARTIAL, a system whereby actors could evaluate their design layout based on its performance in several metrics (Aish and Fleming, 1977). Woodbury et al. define the term design space as a “network structure of related designs” (2005) and its exploration as “a guided movement through a space of possibilities” (1999, 2000). There is a wide body of research focusing on the interaction between designers and the solution space they navigate with the help of computers (Burrow and Woodbury, 1999; Woodbury et al., 2000; Woodbury, 1991; Woodbury and Burrow, 2006a, 2006b, 2003), which partly predates the emergence of popular parametric design tools, such as Generative Components, Grasshopper and Dynamo. As a result of this new generation of software, designers stopped creating static solutions and moved on to encoding building logic into parametric models. Thus, from solution spaces that were defined by a low, human-producible number of options, the current status quo is that in which one has the potential to evaluate a continuum of data points, each representing a unique design variation. Consequently, when employing parametric modelling, designers both define and subsequently explore design spaces. Simplifying, the process largely consists of cycles of generation and evaluation: a designer sets the input parameters, generates the result, and finally evaluates it according to both objective factors as well as subjective criteria.
The process of generating discrete instances from a given design space, as defined through a parametric model, can be automated by the pre-calculation of a discrete set of design instances. Current parametric modellers, such as Grasshopper or Dynamo, do not allow for displaying multiple states simultaneously, which makes a comparative analysis difficult. By leveraging the technical infrastructure defined previously, one can treat a parametric model as a simple technical actor and, through a custom protocol composed of several new client-interpretable messages, create a workflow that allows for a concurrent calculation of a solution space. The methods presented here serve revolve around “brute-force” sampling, and serve only to demonstrate a technical contribution[38].
In more words, one initially defines the degrees of freedom of the parametric model that one wants to pre-calculate, as well as its evaluation criteria, if present. The geometry is curated from throughout the model by being transmitted into one original SpeckleStream A; the input variables (sliders) are flagged by prefixing their name with the SPK_IN string, and the output variables (besides geometry, and embodied in Panels) with SPK_OUT. The accuracy and type of the sliders will also determine at what interval they will be sampled: for example, an integer slider with a minimum value of 0 and a maximum value of 10 will contribute 11 data points. To enable pre-calculation, the SpeckleStream sender component must signalise this by setting the option of “Enable Compute” to true. If the exact same definition is opened multiple times on multiple computers, all of them will participate in the computation process. Subsequently, with the aid of an online interface, a user can start the precomputation process, which will distribute equal amounts of data points to each compute-enabled client. The process is as follows:
- The online client W accessing Stream A broadcasts a custom “compute-enabled” message in Stream A’s WS message room.
- Clients X, Y, and Z receive that message and send a direct “compute-enabled-response” message to W, which also contains each compute-ready client’s parametric model hash.
- Online client W waits for a predefined interval of time (2 seconds) for the above responses to arrive. Afterwards it compares the hashes of each response to check that they do not differ (as this would imply a different parametric model).
- Subsequently, online client W will create the permutation set of the solution space based on the input provided by X, Y and Z.
- Afterwards, it will then start sending “compute-request” messages containing one different set item to each of the three clients.
- A client, upon receiving a “compute-request” message will calculate that specific instance of the solution space and save it in the database as a new SpeckleStream. Once this is done, it sends a “compute-result” message.
Parametric modelling software, such as Grasshopper, is not designed to take advantage of modern multi-core processor architectures, as its main concern is to calculate fast only one instance of the model at a time. Consequently, parallelising this process reveals performance improvements even on a single modern laptop, with each extra instance of Grasshopper being open for the generation of a solution space contributing an almost two-fold increase in speed. This opened up new avenues in digitally enabling participatory design (Figure 52). Parametric models, through their inherent flexibility, can be used as a negotiation, or communication tool, by designers. Previously, this required specialised equipment and software that was thus limiting the outreach and engagement of a parametric model: one needed to have access to CAD software in order to use it (Knecht et al., 2019).

Figure 52: Screenshot of the online interface developed for citizen engagement, based on a pre-computed parametric model. From Knecht et al., 2019.
Another example of the potential to integrate technical actors arose from the field of bespoke manufacturing. Two separate companies, NStance and Simple Wood Goods, used Speckle as the data interface between their customers, their proprietary design logic and their manufacturing process: the former towards 3d printing, laser cutting or metal casting of bespoke jewellery (Figure 54), whereas the latter on CNC milling and assembling of a parametrically defined table (Figure 53).

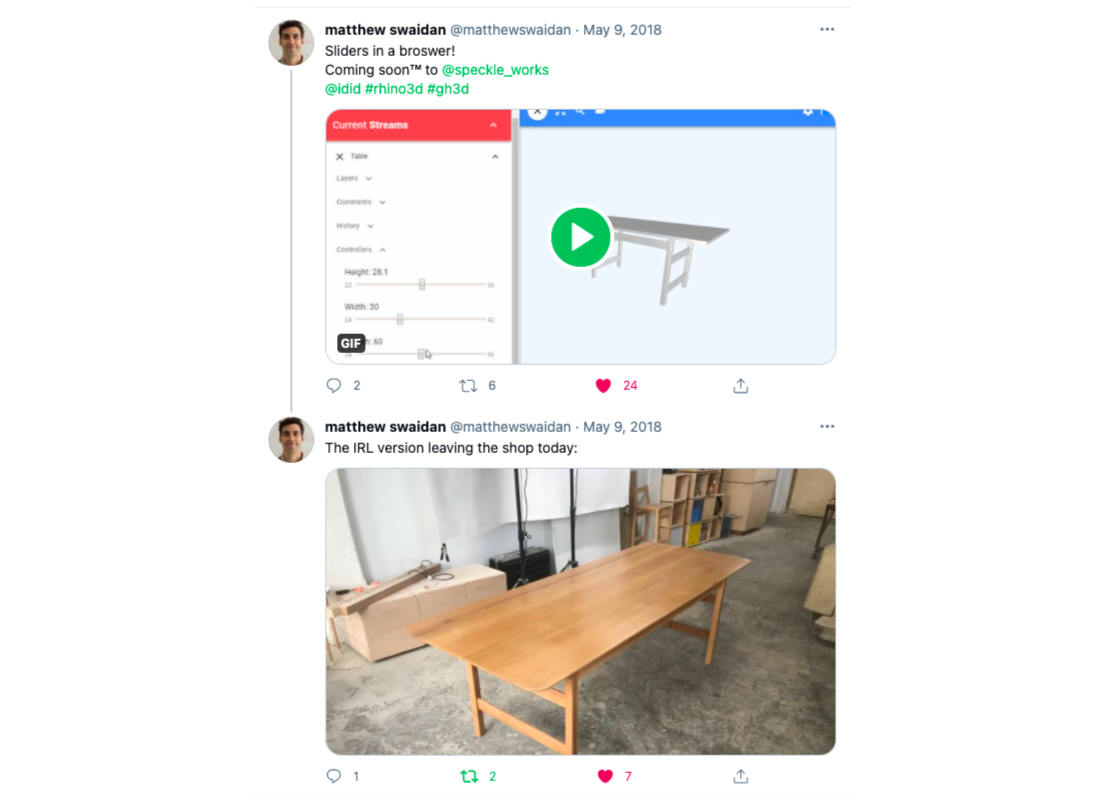
Figure 53: Simple Wood Goods example application: web interface (left), customised real product (right). Image rights: Matthew Swaidan, 2018.
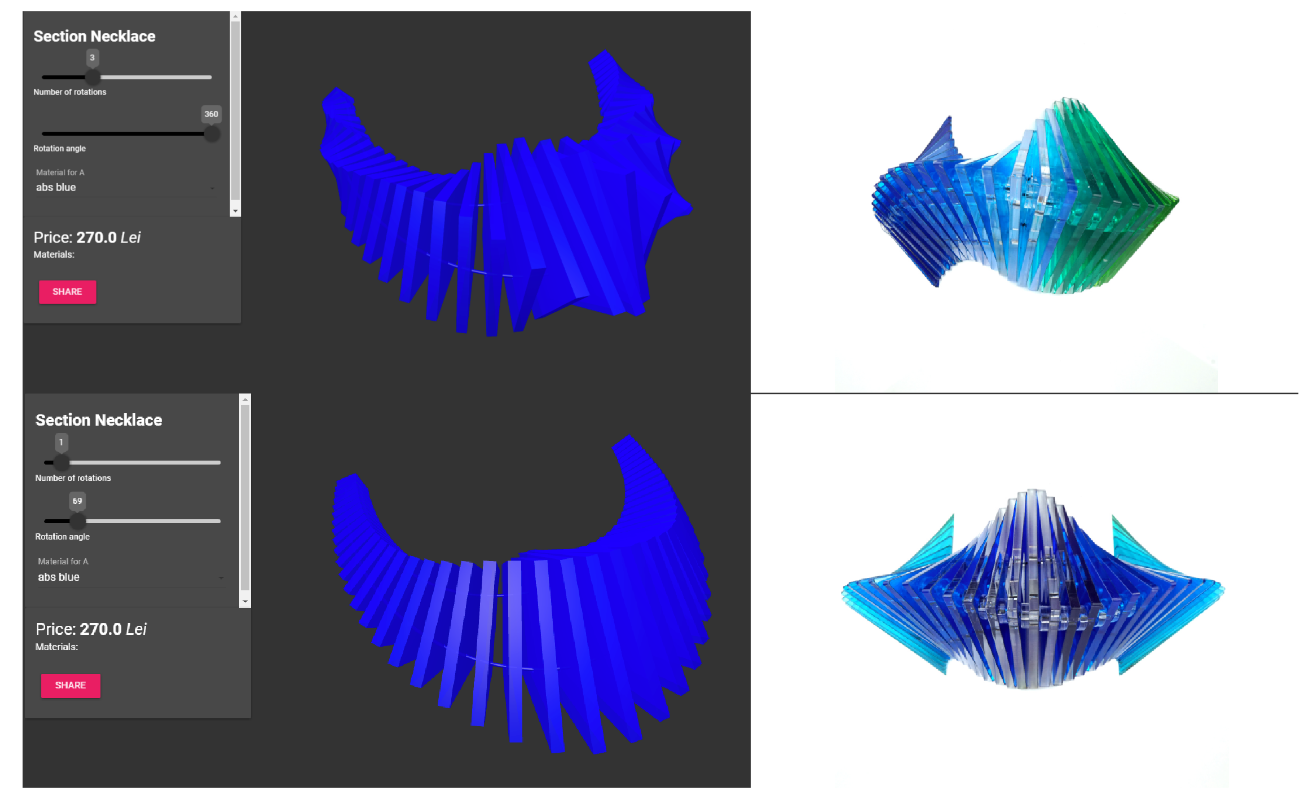
Figure 54: NStance web application (left), and corresponding ordered product (right). Image rights: nstance.ro, 2018.
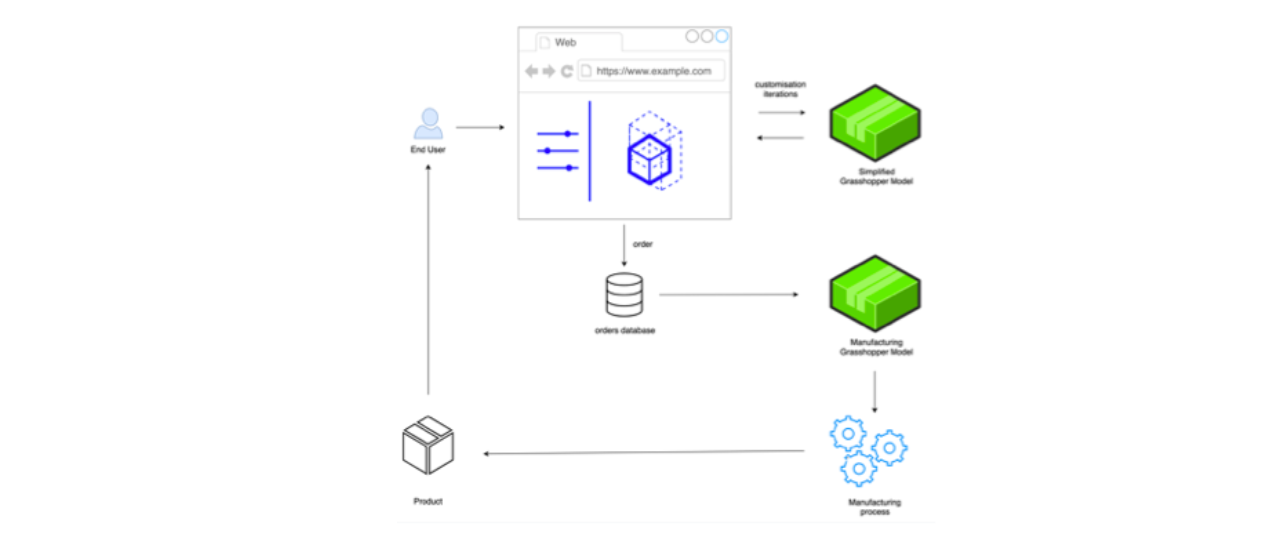
Figure 55: Process diagram summarising the information flow between end-user, model, and manufacture.
The resulting process is equivalent in both cases. As the diagram above shows, it starts when a person accesses the online customisation interface developed (Figure 55). Initially, there are a series of exchanges, or customisation cycles, during which the user configures the end product to suit his needs. Both NStance and Simple Wood Goods used a separate parametric model specifically geared towards visualisation. Subsequently, when an order is placed, it is thereafter picked up and processed through a much more detailed parametric model that is, ultimately, producing the information needed for manufacturing. This amounted to 2D dimensional laser-cutting files in the case of NStance, grouped together with a labelling and colouring system; in the case of Simple Wood Goods, the Grasshopper definition would ultimately produce machine code for a CNC router. Followingly, the product would be manufactured and shipped to the end-user.
In the case studies presented above there was always a human involved in the process (in the manufacturing step). Nevertheless, using the same programmatic base used to enforce a social communication contract, one can include technical actors in the “conversation” that execute codified tasks, automating parts of the design and manufacturing process, through the elaboration of custom, machine-to-machine, protocols.
6.5.2 Design and Visualisation Workflow
Propagating information across a loosely coupled design process is crucial for the correct functioning a multi-role team. During the industrial secondment within HENN Berlin, a workflow (and data sharing patterns) revolving around the design and delivery of an early stage architectural competition has been observed. The actor network was composed of: (1) several architects which had the conceptual and design responsibility of the overall project (the design team, with its own internal leader—the project manager); (2) the visualisation team, which was responsible for the delivery of the project’s graphical images and diagrams (which was simultaneously helping several other projects); and (3) the firm’s senior partners who would oversee the progress of the project on a weekly or bi-weekly basis.
The habitual interactions revolved around weekly cycles determined by the senior partners’ reviews. For these half-day long meetings, the design team would summarise its progress and, together with the visualisation team, produce graphical output that would then later be used as a basis for the presentation and discussion with the senior partners. Most of the design work happened in Rhinoceros (sometimes aided by parametric modelling or environmental analysis in Grasshopper). Based on these exact same 3D models, the visualisation team would then produce renderings and diagrams for presentation purposes.
This approach, while extremely efficient, was nevertheless susceptible to a breakdown in communication. For example, there were several cases in which the renderings were produced based on stale model data, fact which then led to an unproductive review meeting in which the project lead responsible and his team were “talking” something different than they were “showing”, much to the distress of all the parties involved. The reasons behind this failure can be attributed to many factors, some of which have to do with the digital infrastructure used for communication purposes. The file-based approach used (shared network drive) does not propagate information to the responsible parties; there is no mechanism by which the interest and relevancy of specific design data can be tracked and acted upon.
Within this context, the SpeckleRhino integration was used to trial an alternative approach. The design team split up its working models into several SpeckleStreams which were then read by the visualisation team. Data was distributed according to common-sense patterns that were specifically helpful for this particular workflow, namely by individual building and their respective façades, as well as several key elements that represented central project cornerstones, such as the lobby of the central building and several key site-based landscape entrances. Accordingly, the main difference between approaches that the teams reported was a certain “peace of mind” that came because of the assurance that whenever they would need to operate on specific design data, they could rest assure that it is “up-to-date” and not stale. For example, a member of the rendering team gave an account of how, whilst preparing his visualisation model for a render, he could instantly see that the façade of the building changed as the design team were doing last minute changes to it. Consequently, he immediately noticed that certain assets (people, cars) were now starting to obstruct a key element of the entrance to the building, and could re-adjust his model so as to prevent this, thus “not wasting two hours” setting up a bad rendering scene.
Similar workflows spread internally, within the project’s core team for both coordination roles amongst the various loosely coupled parts of the overall design (massing, landscaping, parking, structure, facades, etc.). The main advantages cited by the “early adopters” was the absence of costly and “clunky” imports and the friction associated with sharing whole files over a network drive, no more “copy-paste” operations from one Rhino model to another and the fact that the process was “faster”. A widely used workflow was the possibility to do on-the-fly reviews, with senior partners being able to access the in-progress designs via the online 3D viewer (SpeckleThreeViewer) and provide commentary and guidance even while travelling from their mobile devices. This revealed different interactional requirements of the digital design process (i.e., comments, graphical notes, sketching on a 3D model, etc.), which shall be discussed towards the end of this chapter. To conclude, this simple case study validated the relevancy of a digital communication process that not only updates design data, but goes one step further and notifies and propagates the relevant information to the relevant parties in an accessible manner based on the situation at hand.
6.5.3 Design and Façade Engineering
Another example of multi-disciplinary collaboration where Speckle was used as the vehicle for propagating information across a diverse range of actors was in the design of a central, “iconic” element of an airport expansion. This element consisted of a 90 meter wide circular mixed cable-net and circular beam structure that resembled a “vortex”, and it supported upwards of 1000 glass panel elements, each unique in its size and material type. Unfortunately, at the time of writing, the project is restricted by confidentiality requirements, which prevent us from providing further, more specific, details.
The team responsible for its design was spread out across three companies, namely “The Architect”, “The Structural Engineers”, and the “Façade Engineers”. Specifically, while the general outlines of the design were fixed—specifically the “vortex” metaphor, and the boundaries of the element—the actual rationalisation of the concept into a buildable object left multiple degrees of freedom that needed to be explored in order to reach the best compromise in terms of budget, aesthetics, performance and ease of construction.
At the initiative of the façade engineers, the project team devised a workflow that would allow them to rapidly iterate through various options while simultaneously informing all of the participants of the outcome. This workflow was thereafter implemented with Speckle. Specifically, the team separated the informational concerns into three main speckle streams based on the disciplines involved, namely (1) design, (2) façade engineering and (3) structural engineering. The design stream informed both the facades as well as the structures stream. The structures and facades streams were tightly intertwined in a feedback loop, as they exchanged much technical information throughout the course of the project. While at the beginning of the design process, both the structure stream as well as the façade stream were fed back to the design team, eventually, the façade stream evolved into a centralised data source for curated information that the architectural design team could thereafter act upon.
As the project progressed, each discipline data stream started being informed by and informing several other models through secondary speckle streams. These pertained to various sub-tasks that, as the project progressed, could no longer be held together into one model. For example, (3) structural engineering was having three separate child models, namely a (3.1) load analysis stream, (3.2) movement accommodation and (3.3) secondary structure design stream. (2) Façade engineering, besides curating the input from (3) structural engineering, was also being informed by streams referring to (2.1) cable net movement checks and (2.2) drainage analysis (Figure 56).
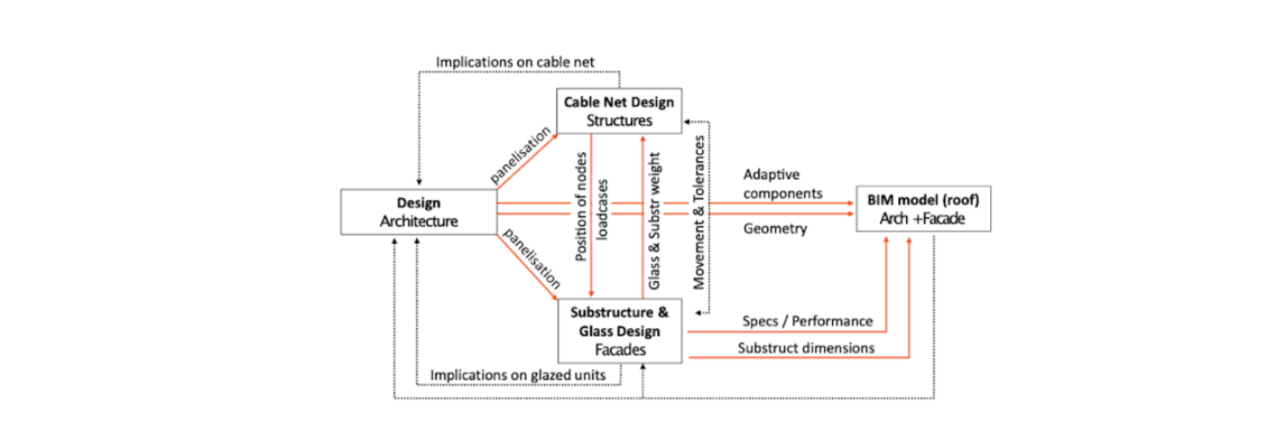
Figure 56: Diagram representing the communication network between the stakeholders. Image rights: Fernando Ruiz/Arup, 2018.
The feedback received was mostly technical in nature—specific issues with dealing with complex NURBS-based geometry elements—but contained interesting reactions to communicative aspects of the process. Specifically, the engineers and designers were happy with the “responsiveness” of the process, nevertheless they requested more refined means of controlling the data updates so as to not “flood” the system with arbitrary data (this was implemented). Several positive remarks were addressing the fact that the author of a specific SpeckleStream could see in the online interface who was consuming it, or, in other words, where that information is received. Thus, the façade engineer working on the drainage analysis noticed that his analysis results were being consumed by a colleague in the structural engineering team, who was using that information to inform the size the secondary beam structure. Nevertheless, this view did not satisfy the needs of the two project managers from the design and façades teams: they expressed the need to be able to have an overall view of all communication network, similar to the diagram above, in order to coordinate the efforts of their team members.
Similarly to HENN, the project managers’ feedback also described another set of interactional requirements coming from the coordination meetings. Specifically, they expressed the need to be able to textually define issues on specific elements, or have various analysis views in the online interface that would allow them to point out specific evidence to support their arguments while discussing the compromises in the design of the “vortex”.
Lastly, by being able to exchange design and analysis information in a fast and flexible manner, the actors involved in the process were able to iterate and evolve the topological structure of their communicative network towards an “optimal” state that matched, as the design progressed, new instances of problem definition and subsequent resolution. In other words, they were able to support the dynamic management process of the wicked problem they were tasked with (the design of a complex structure).
6.5.4 Summary
The three case studies presented in this section are summarised in the table below (Figure 57). The key learnings are expressed in terms of positive observations (+), and ones found lacking (-).
| Case study | Actors | Summary |
| 6.5.1 | (a) End-users | (+) Fast transactions between (a) end-users and (c) technical actors enabled online customisation cycles. Existing file-based approaches would not be suitable due to their high overhead. |
| (b) Product Designers | (+) Custom protocol definitions enable more than simple “update” notifications between participants, and open up the design and manufacturing process to automation. | |
| (c) Technical Actors | (-) Product designers were partially dissatisfied with the limitations that the online medium offered in terms of presentation. | |
| 6.5.2 | (a) Architects | (+) While file-based approaches were successfully used in the past, Speckle allowed (a) architects and (b) visualisation artists to coordinate better. |
| (b) Visualisation Artists | (+) Reliably being able to observe changes in real-time allowed (b) to feel in control of the process, and pace around (a)’s creative output and instructions. | |
| (c) Senior decision makers | ||
| 6.5.3 | (a) Architects | (+) All stakeholders (a, b, and c) were pleased with the responsiveness of the system and the ability to organically structure their communication process. |
| (b) Structural Engineers | (-) The product managers from (c) highlighted the need for a more comprehensive management interface to track the communicative exchanges between the team’s members. | |
| (c) Façade Engineers |
Figure 57: Data transaction case studies summary table.
The case studies presented above involved a diverse number of stakeholders from the design process, such as engineers, architects and product designers which have used Speckle in order to improve their workflows. The existing implementation, when applied on a larger scale, was found lacking in this regard as project managers could not have an overview of the dialogue being undertaken: while being able to trace source and dependents on a single stream basis, on a project basis, involving multiple streams, this was not possible.
The need for an “global” overview arises from the fact that communication in the design process is a dynamic process, as also evidenced by the last two case studies. These highlighted the organically evolving network of data sharing, tending to its maximum relevant state, as Sperber and Wilson would put it (2008). This was seen by the participants as a welcome development. Notwithstanding the limitation mentioned above, the fact that information is not simply mechanically transmitted, but that transactions between the stakeholders tie them into tangible communicative contracts, was beneficial in comparison with the existing file-based approaches that do not establish these relationships.
6.6 Conclusion
This chapter looked at enabling efficient and meaningful design data transactions from a technical and social point of view. All communication processes rely on a social contract among participants, two key properties of which are nextness and sequentiality. Nextness is the property of utterances to be adjacent to each other so as to maintain relevance—essentially, their speed and frequency. Sequentiality refers to the logical order in which utterances are exchanged, and ensures the overall coherence of a conversation. In a digital environment, as opposed to a human, face-to-face one, these two key perquisites of communication are not directly enforced. Subsequently, the issue behind the lack of nextness in digital design communication was analysed. Second, the investigation focused on how the sequentiality of digital information exchanges between actors can be expressed and revealed to the participants in order to reduce the intensive coordination requirements resulting from detaching the information being transmitted from its source.
In a digital environment, nextness, or adjacency in between informational exchanges, is directly dependent on the size of the data payloads that are transacted. A file or model-based approach imposes a high cost, thus reducing the frequency with which stakeholders “communicate”. In order to increase the speed with which these transactions happen, Section 6.2, Optimising Transactions: Differential Updates puts forward a client-side differential compression algorithm operating at the level of design data object sets that leverages the approach to object identity and immutability adopted in the previous two experiments to incrementally create a shared informational context.
This is thereafter used to reduce information redundancy and consequently the amount of information being transferred. Similarly to natural dialogue, where participants rely on their shared context in order to increase the relevancy of their exchanges, so does Speckle leverage a technically created context for speeding up design data transactions. In regards with sequentiality, the mechanism for tracking the interdependency of the communicative exchanges in a digital workflow described in Section 6.3, Assembling the Network was implemented. This was achieved by separating the storage from the actual message transaction system, thus allowing for fast, spontaneous messaging between end clients as well as reliable transmission of very large data sets. The actual tying in of data, author and source is achieved through a new data structure (clients) that keeps track of these aspects, complemented by a discretionary access control policy, which authenticates every action against a specific end user’s credentials (Section 6.3.1, Users and Section 6.3.2, Clients).
These technical solutions were validated in a technical environment, and empirically assessed in terms of performance. Furthermore, several applied case-studies, emerged from the usage of Speckle within the living laboratory context of this project, have served as the basis for a qualitative analysis. Specifically, the findings of this chapter can be summarised as follows:
-
The transaction size can be decoupled from the size of the model, thus allowing for much smaller, and faster, change-dependent digital design data exchanges (Section 6.2). In more detail, the empirical observations show that:
- Differential updates, on average, are half the size of an equivalent file-based transaction. Furthermore, based on empirical observations, by employing this method, transactions can be as much as five times faster (by virtue of being five times leaner in size) (Section 6.2.2).
- Nevertheless, differential updates have no theoretical upper limit when it comes to potential efficiency gains, and in their worst-case scenario they are equivalent to a file-based methodology (Section 6.2.3).
-
Informing users about who is dependent on their data, as well as when the data they are depending on, coming from a different person, has become stale, establishes a measure of productive sequentiality which is sufficient for individual tasks (Section 6.5.2).
-
Because communicative networks can be assembled organically (as previously discussed in Section 5.6 of the previous chapter), this potentially leads to a disorderly process. The case study presented in Section 6.5.3, has consequently revealed this shortcoming and identified the need of stakeholders in coordination roles (project managers) for a project-wide overview of the activity/process network.
Footnotes
[33] Based on the Ofcom 2018 report (https://www.ofcom.org.uk/research-and-data/telecoms-research accessed 12th Oct. 2019).
[34] Only the transactions that were explicitly saved by a user (as a stream version) could be analysed. Furthermore, transactions that do not show any change have been excluded.
[35] This figure is different (but not by much) than the one presented in Chapter 4 as it is always in flux, depending on the objects present in the database.
[36] This potentially favours the “Bulk”, file-based approach, as this is not always the case: for example, adding a previously removed set of objects.
[37] To note, the authentication layer has, at the time of writing, evolved to incorporate other methods, such as Active Directory, or other, OAuth-based flows, which delegate the proof of identity to other services (e.g. internal corporate identity providers, Twitter, Github, etc.).
[38] This matter has been researched extensively in the field of design space exploration. Brander et al. have studied how design professionals generate and evaluate designs (2014). Other literature looks at various sampling methods and their implications on the act of exploration (Burrow and Woodbury, 1999; Woodbury et al., 2000; Woodbury and Burrow, 2006).